All work

Chartbeat · B2B analytics · Product design

Turning hidden click data into same-day decisions for newsrooms Link Click Explorer: a new page in Chartbeat’s analytics dashboard

Chartbeat was already tracking every link click on publishers’ sites, but clients couldn’t see any of it. Affiliate teams at publishers like Reach waited hours for partner data to know which articles drove clicks, so they couldn’t act until the day was mostly over.

I designed Link Click Explorer, a new page that shows where readers click, which articles sent them there, and how today is pacing against last week.

Role
Product Designer, end-to-end design
Team
1 PM, 1 senior designer (mentor), engineering, data science
Scope
Information architecture, interaction & UI design, prototyping, concept testing

Tools: Figma, FigJam, Gong

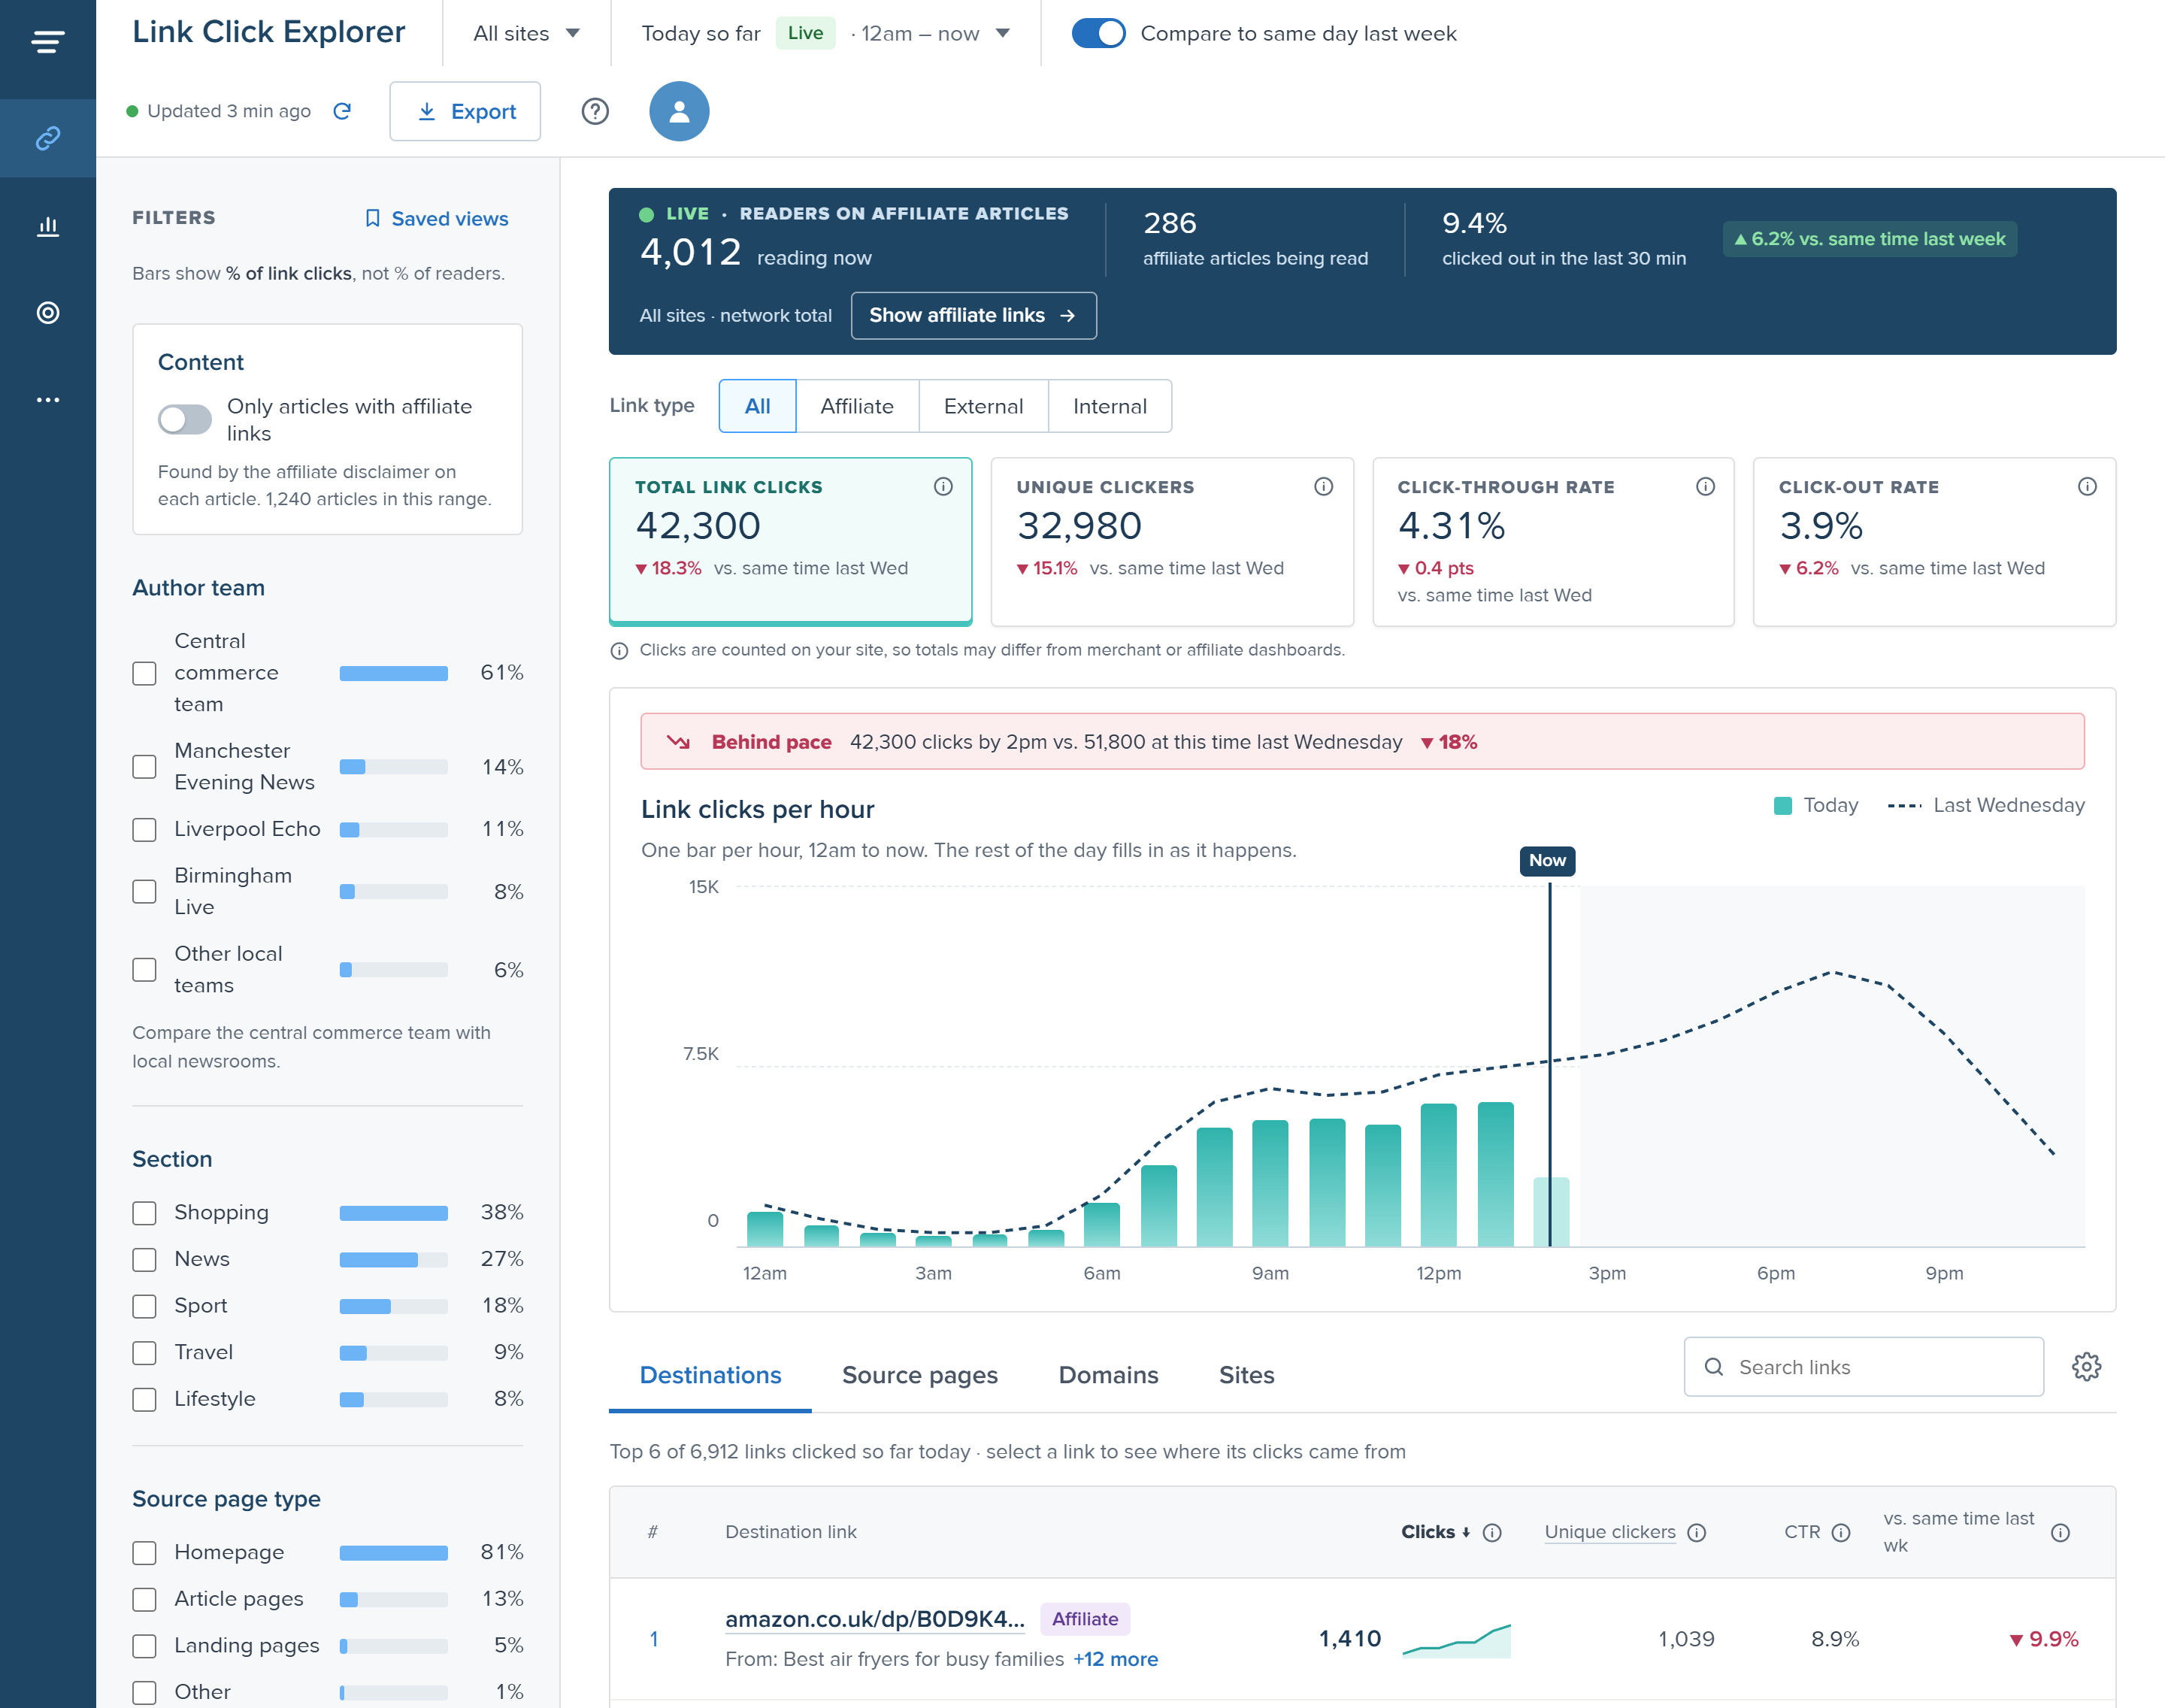
Link Click Explorer, Today view: live readers on affiliate articles, link click totals compared with last week, a behind-pace banner, clicks per hour against last Wednesday, and the top destination links
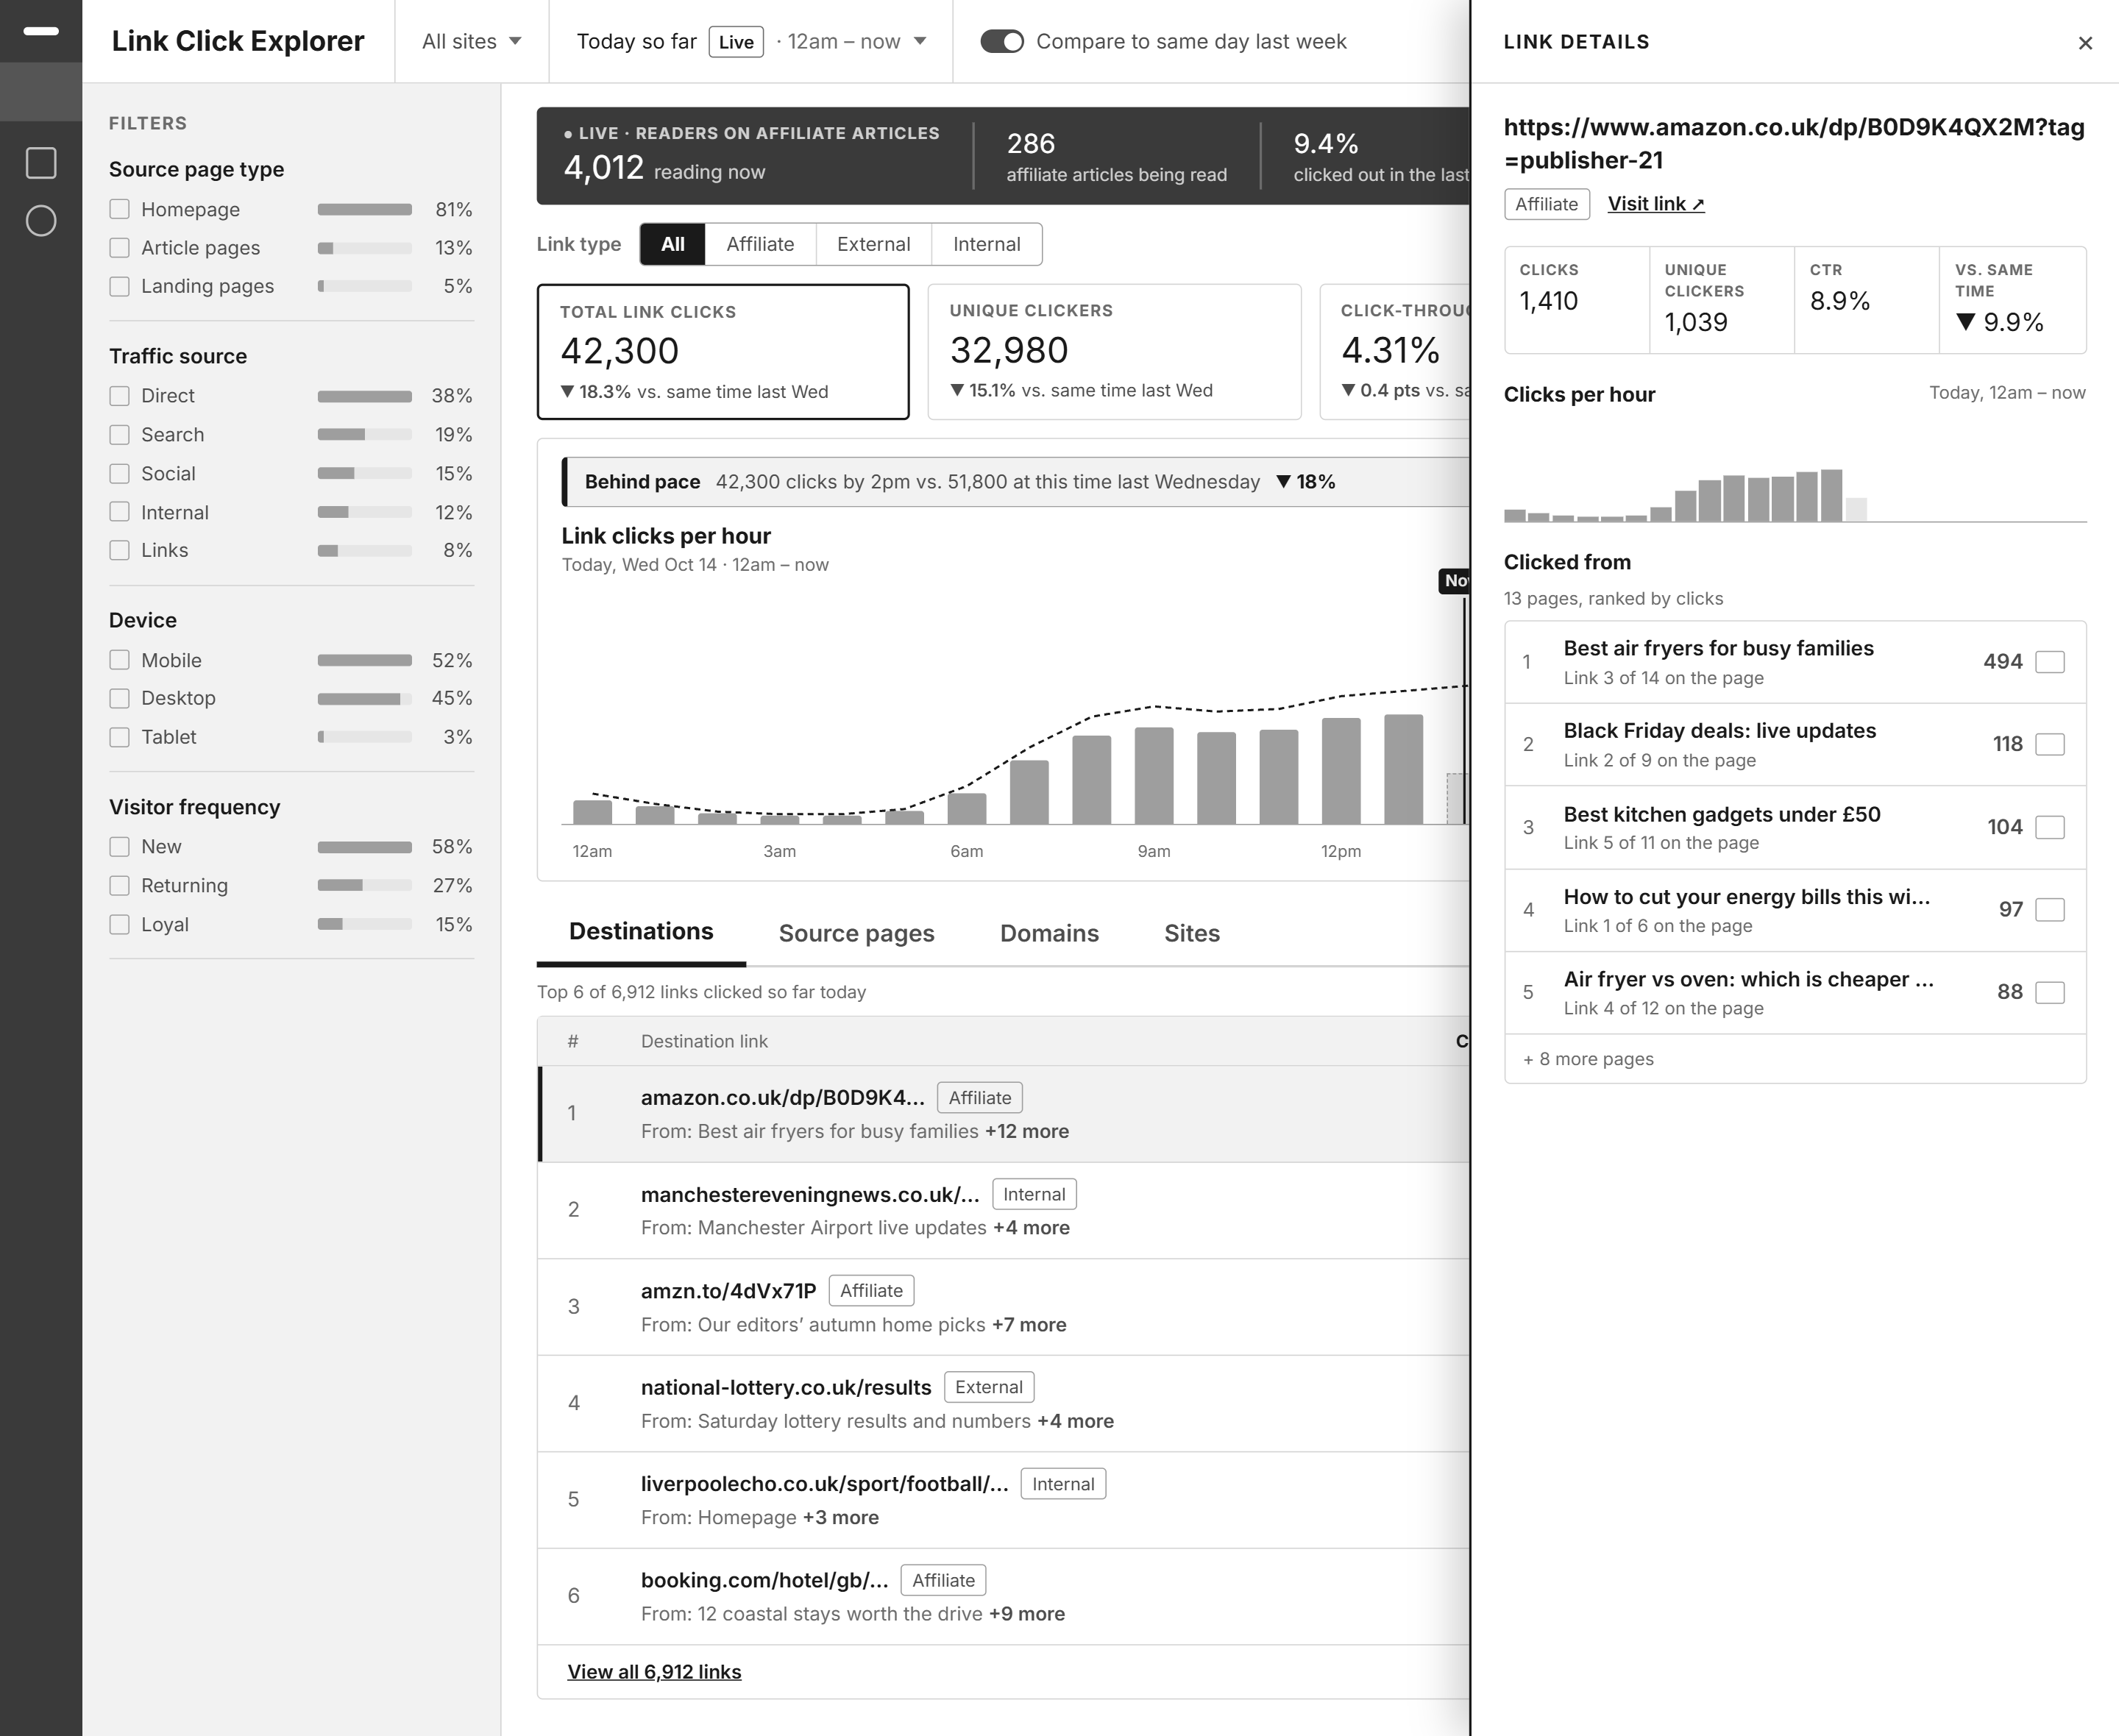
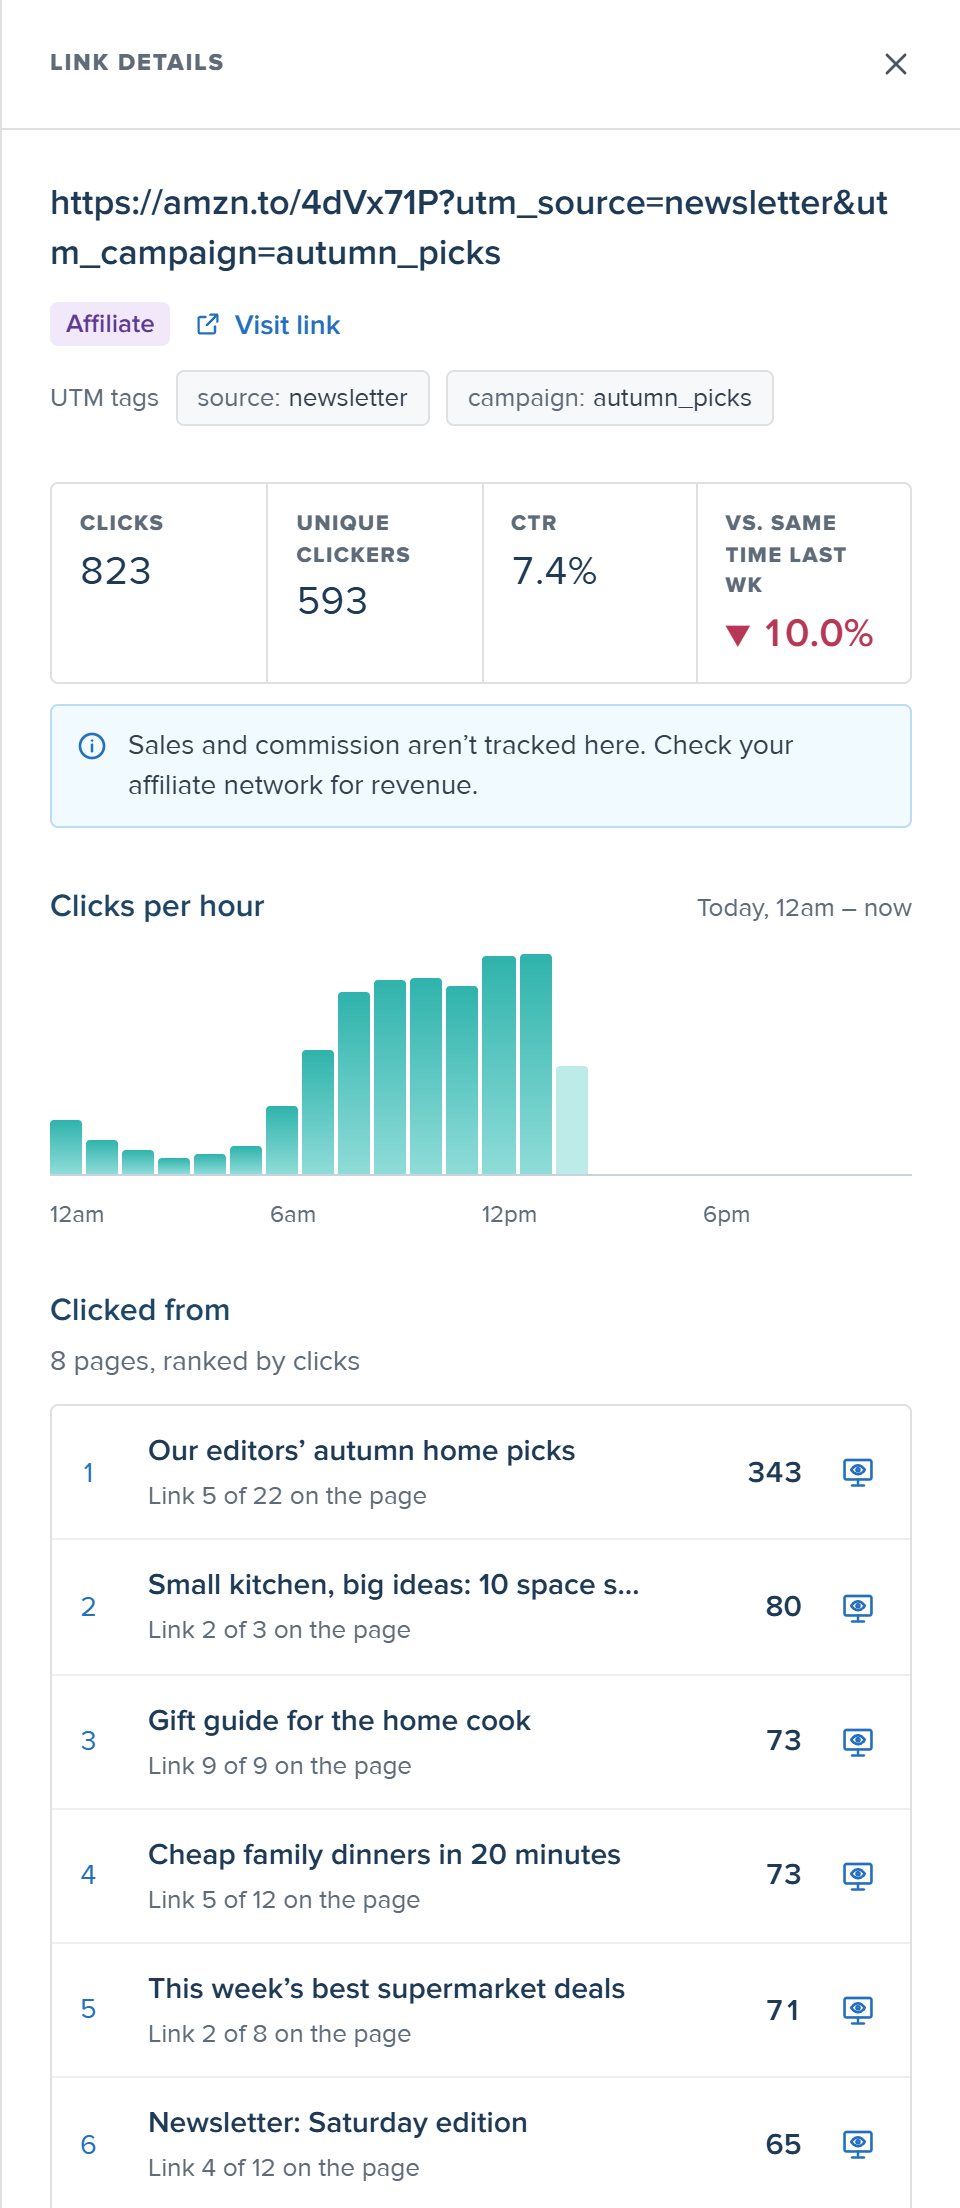
Link details panel for one affiliate link: clicks, unique clickers, CTR and change vs last week, clicks per hour, and the pages it was clicked from

Click a screen to see it full size

01Context and the problem

The data existed. Nobody could see it.

Chartbeat is a real-time analytics platform used by thousands of newsrooms in 70+ countries.

It was already recording every link click on publishers’ sites, but showed none of it. So teams couldn’t answer a simple question: where do readers go next, and which article sent them?

Who felt it · Affiliate team, Reach (UK publisher)

They earn money when readers click through to merchants. But partner data from Skimlinks and Amazon arrived hours late, so they couldn’t fix a slow day while it was happening.

“It’s always past, if you like.”
Affiliate lead, Reach

Who felt it · Product & data team, Yahoo Finance

They wanted to know where readers left the site, and from which page, over months. Their internal tool gave noisy numbers, so they wanted Chartbeat to be the source of truth.

“We don’t trust it.”
Product team, Yahoo Finance

The goal

Bring click data into Chartbeat in a way newsroom teams can understand and act on, the same day.

02My role

I owned the design, end to end.

The only designer on the project, mentored by a senior designer and working closely with product, engineering and data science.

What I owned

  • Synthesizing client calls into insights
  • Information architecture and user flows
  • Sketches, wireframes and final UI
  • Prototypes and client concept tests
  • UI copy, tooltips and edge-case states
  • Handoff specs and design QA

Who I worked with

Senior PM
requirements, roadmap, client relationships
Senior designer (mentor)
critique and direction
Engineering
data feasibility and build
Data science
metric definitions
Customer success
access to clients for testing

03Research

Clicks alone meant nothing. Teams needed to know what was behind them.

What I studied

3 recorded client calls Chats with customer success Audit of Chartbeat’s existing dashboards

Insight 01

Clicks need context

“There’s 10 concurrents on it at any given time. So actually 178 clicks is actually pretty good.”

Show click-through rate next to every click count

Insight 02

Where readers came from matters as much as where they went

“It’s great to know where they’re going. But like where were they?”

Every link shows the pages that sent clicks to it

Insight 03

For affiliate teams, readers leaving is the goal

“So effectively like a bounce rate, but like a positive bounce rate.”

Make click-out rate a headline metric

Insight 04

Teams need to act today and look back over months

“If you know that you’re below where you were this time last week… we need to do something.”

A live Today view with pacing, plus 13 months of history

Who it’s for

Affiliate managers

“Is today on track? Which articles are earning clicks?”

Product & data analysts

“Where do readers leave our site, and from which pages, over months?”

04Constraints and scope

Two clients wanted opposite things, and the data lived in two places.

Affiliate team · Reach

“Show me today, as it happens.”

Needs real-time data to fix a slow day before it ends.

vs.

Product team · Yahoo Finance

“Show me last quarter.”

Needs months of history to plan redesigns and ad placement.

The constraint

Real-time and historical data sit in separate databases. Building both in full would double the work.

Link position on the page: available ✓ Revenue: not in Chartbeat, arrives late from partners ✕ Affiliate links: need a rule to detect them

The call we made

History as the foundation, with a focused Today view on top.

Most clients asked for history first. A Today view with hourly pacing still gives affiliate teams their “are we behind?” moment, without rebuilding the full real-time dashboard.

✓ Built in v1

  • Up to 13 months of history, plus a Today view with pacing
  • Link and page drill-downs
  • Affiliate tagging, with editable domains
  • UTM filters to see which module drove a click
  • Export for deeper analysis

✕ Cut for later, and why

Revenue
data lives with partners and arrives hours late
Traffic alerts
need real usage data to set useful thresholds
Authors tab
author and section filters cover v1 needs
Widget placement tracking
a niche need for testing teams

The hardest no was revenue. Every client wanted it, so I left room for a revenue column in the table. v2 can add it without a redesign.

05Key design decisions

Four decisions that turned raw clicks into something teams could act on.

01

One question per panel

Clients asked two different questions about the same clicks. So I designed two panels that mirror each other.

Problem

Yahoo asked “which pages sent clicks to this link?” Reach asked “which link spot on my article works best?”

Considered

One combined panel (two lists fought for attention) and a separate page (users lost their place).

Why this

Each panel answers one question. Mirrored layouts mean learning one teaches the other.

Link details panel: one link, and every page that sent clicks to it
Link details panel One link → every page that sent clicks to it
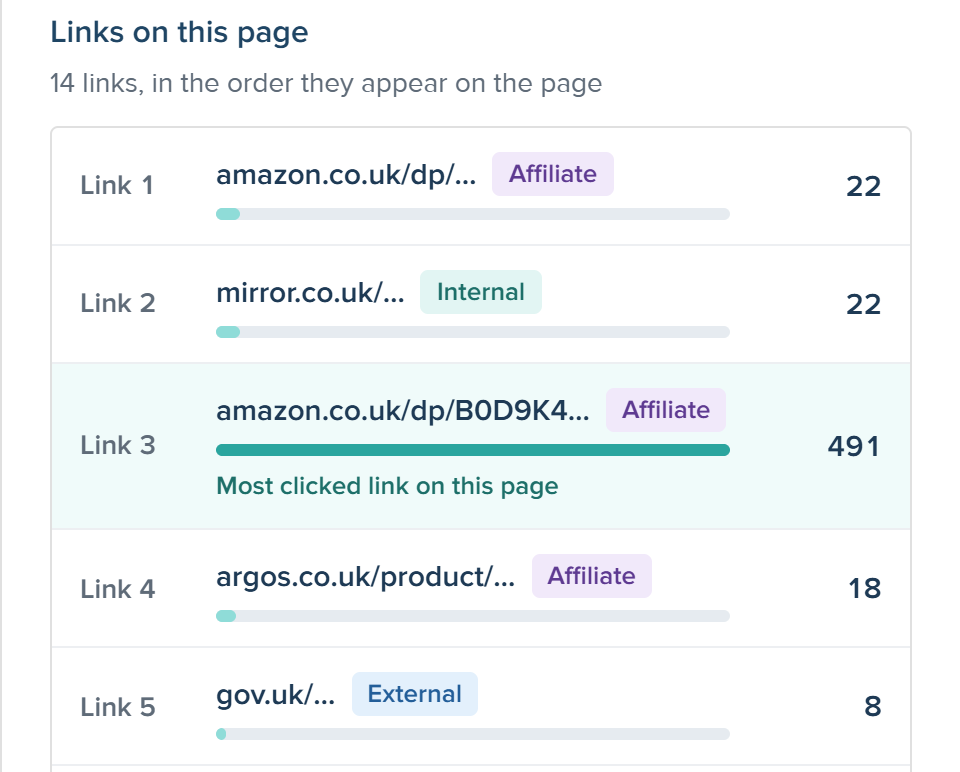
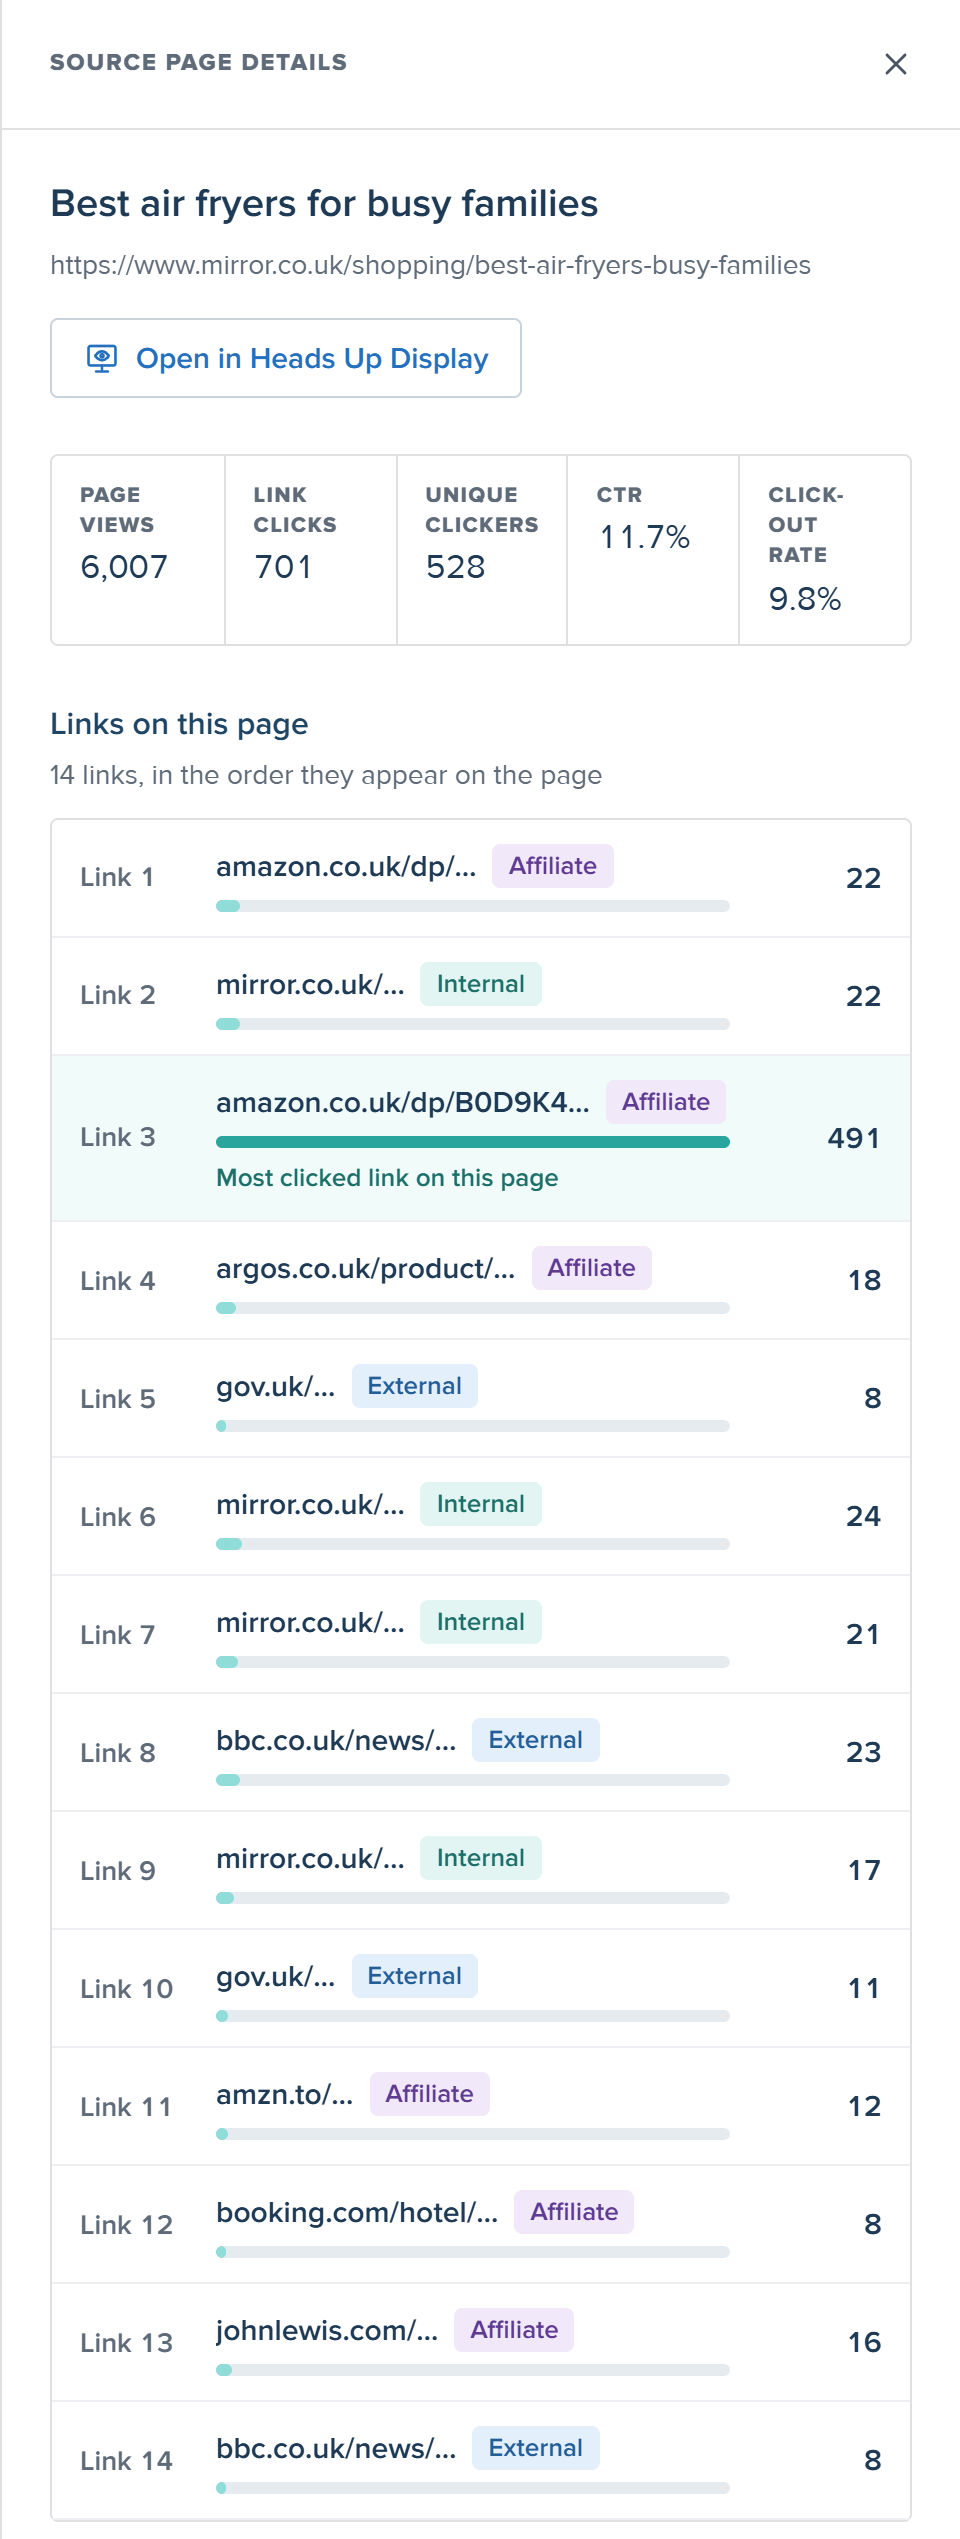
Source page details panel: one article, and every link on it in page order, with Link 3 highlighted as the most clicked at 491
Page details panel One article → every link on it, in page order

Same number, two directions: the 491 clicks on Link 3 appear in both panels.

02

Pacing, not just totals

Problem

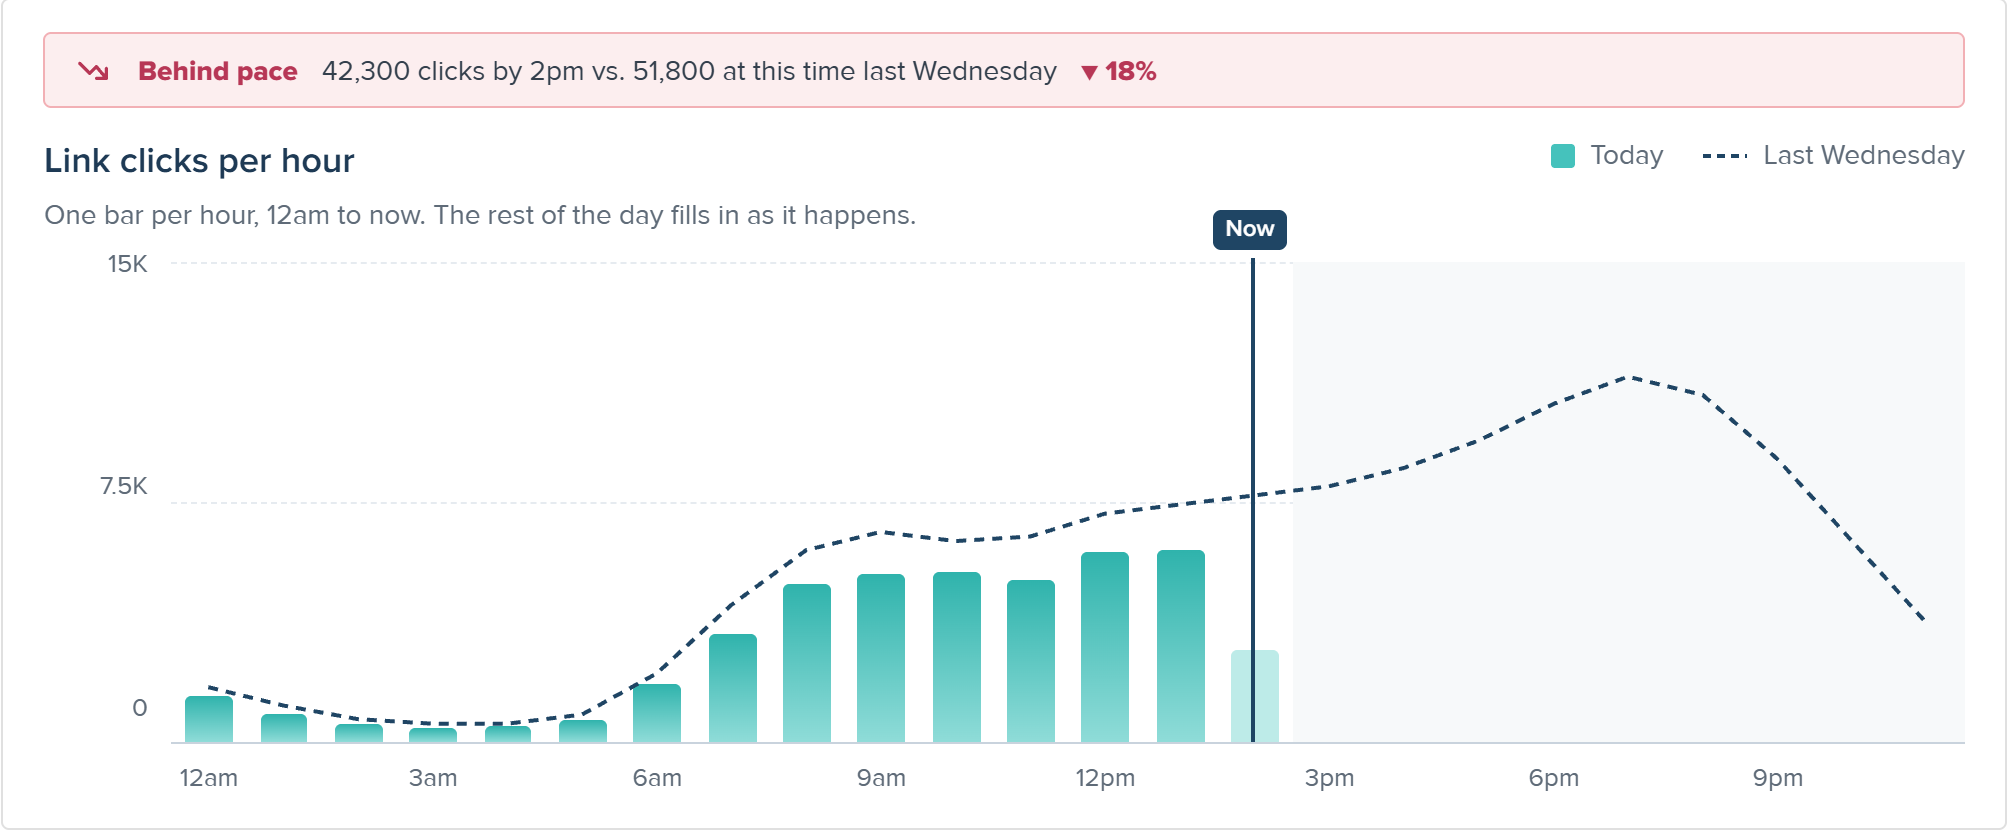
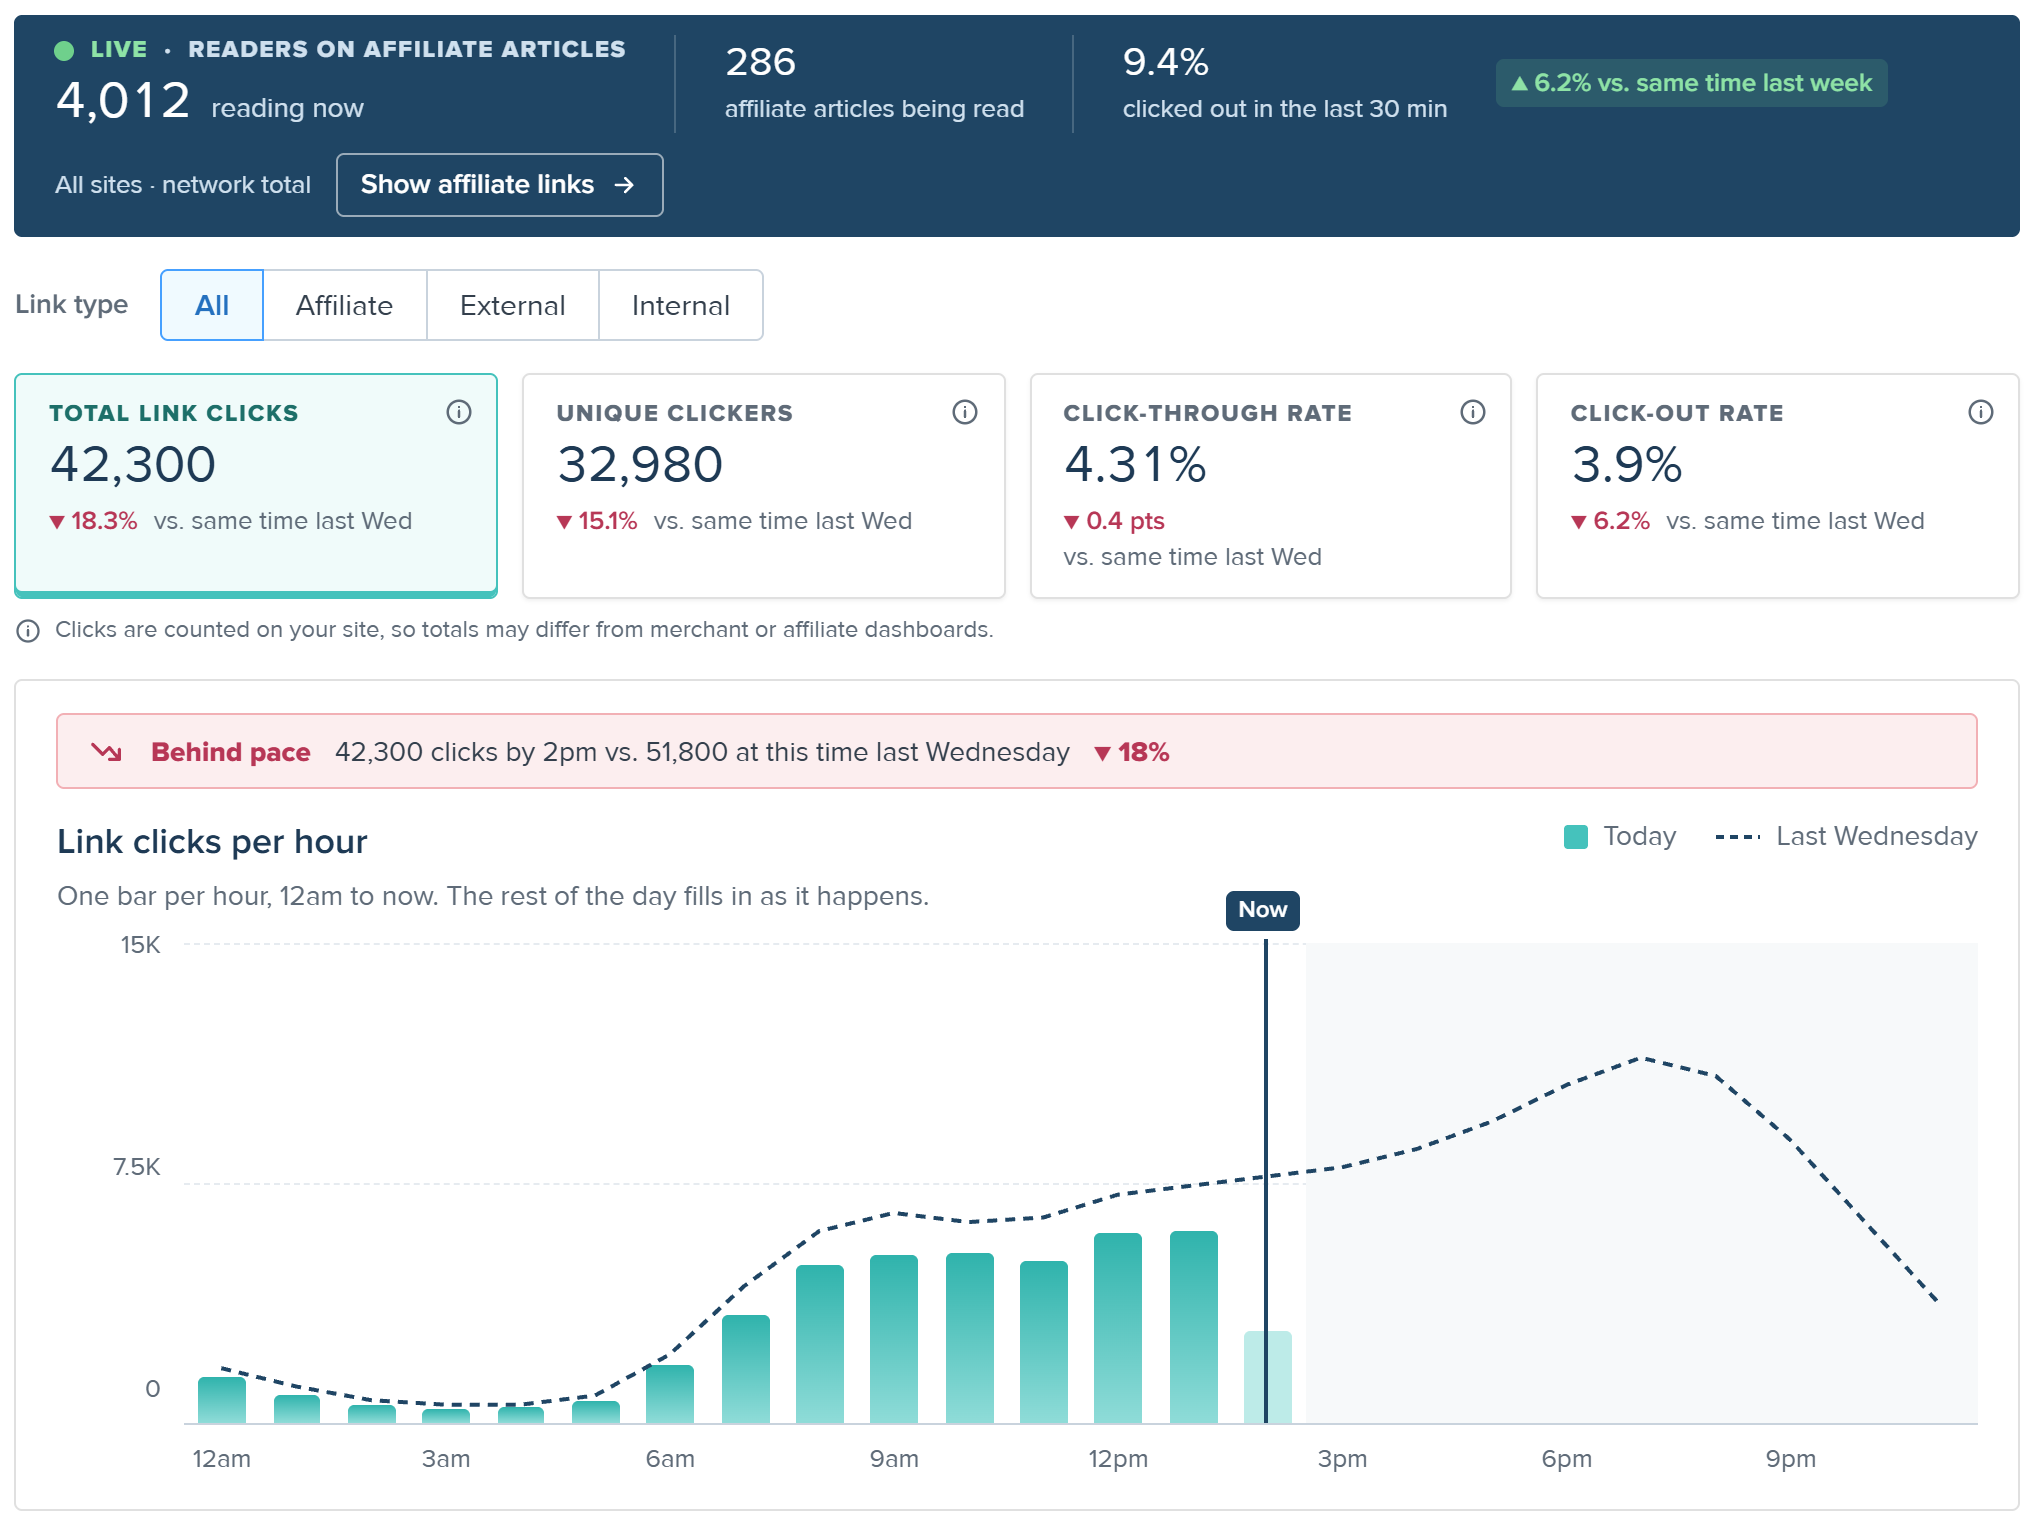
A total like 42,300 clicks doesn’t tell an affiliate team if they’re behind at 2pm.

Decision

A Today view with hourly bars, last week’s line running past “now”, and a one-line pacing banner.

Why this

Comparing to the same time last week stops mornings from looking red all day.

Today view: a Behind pace banner, and hourly link clicks compared with last Wednesday, with a Now line and the rest of the day greyed out
03

New page, familiar product

Problem

Newsrooms already know Chartbeat. A new layout would slow rollout across teams.

Decision

Reuse the filter rail, KPI cards and tabs. Add only 3 new components: pacing banner, live card, link-type badge.

Why this

No learning curve for users, and faster to build for engineering.

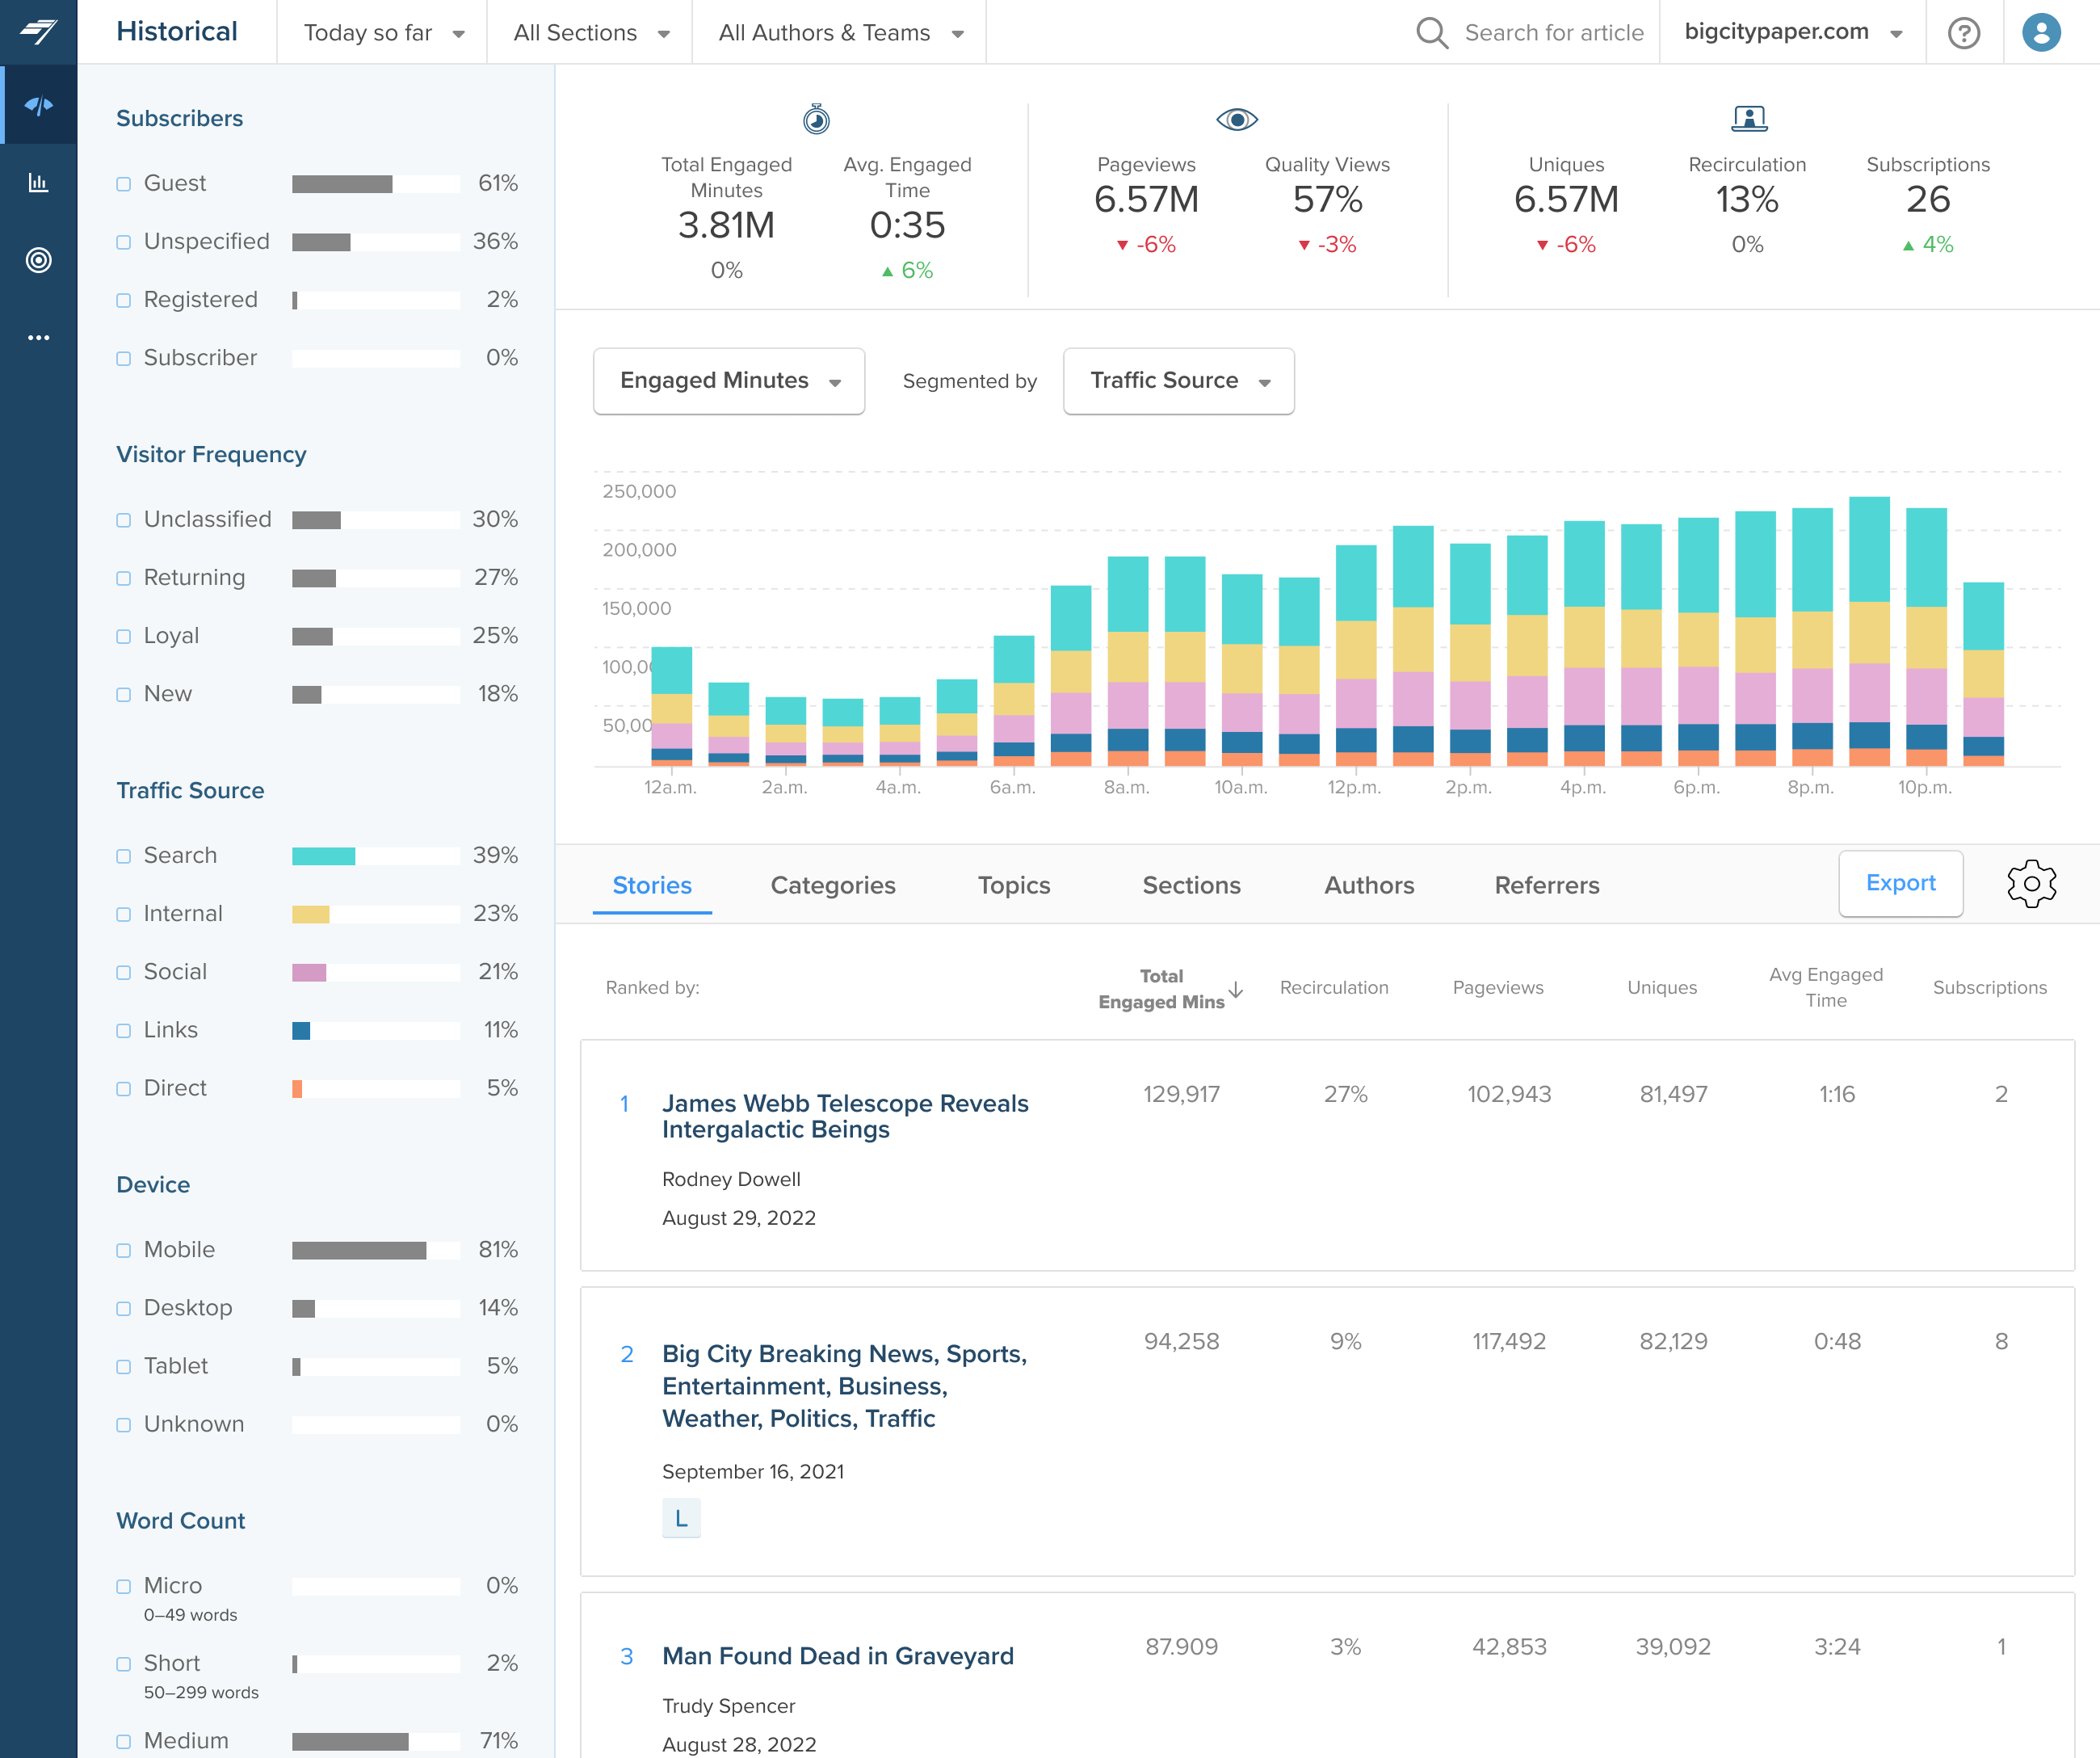
Existing · Historical

Existing Historical dashboard123

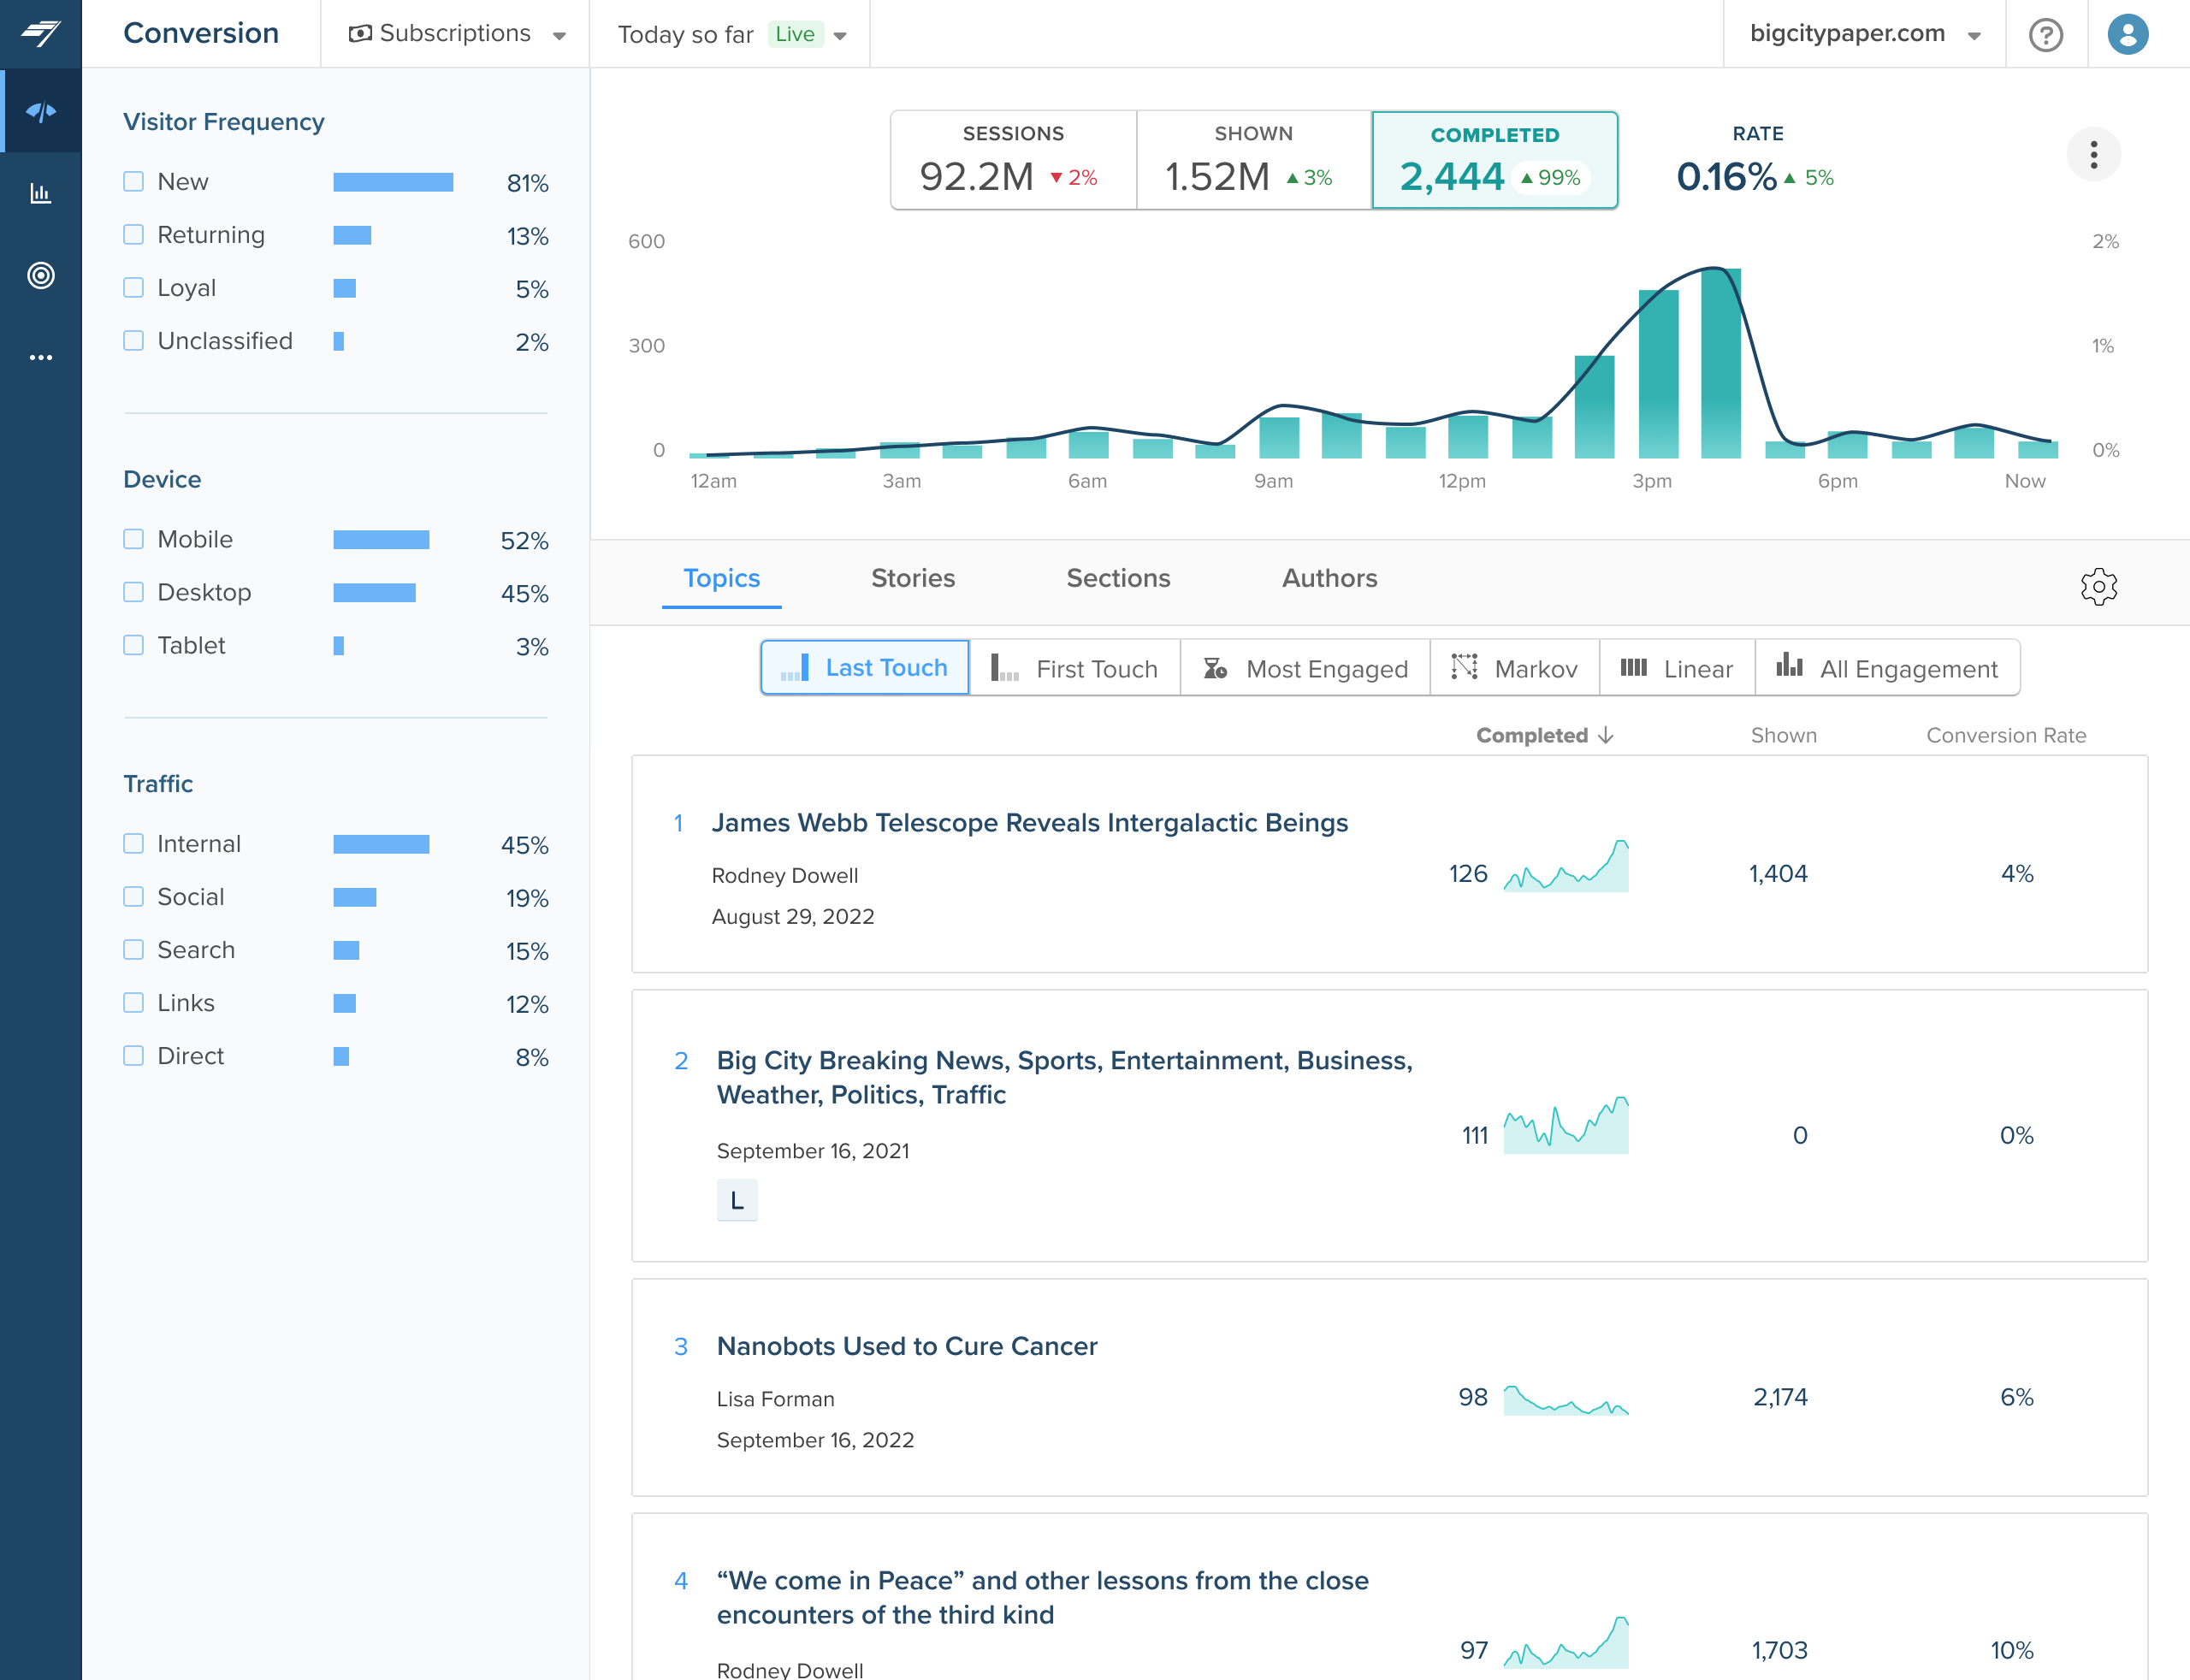
Existing · Conversion

Existing Conversion dashboard123

New · Link Click Explorer

Link Click Explorer, reusing the filter rail, KPI cards and tabs123

1 Filter rail with bars 2 KPI cards 3 Tabs, all reused as they are

04

Design for trust in the numbers

Problem

On a call, a client compared our numbers to his affiliate dashboard: “I think it looks a bit on the low side.”

Decision

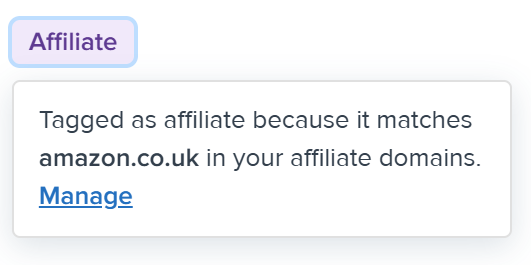
One shared definition for every metric, shown in tooltips. A note on why totals differ. Affiliate badges that explain why they were tagged.

Why this

When numbers don’t match, a clear explanation keeps people using the tool.

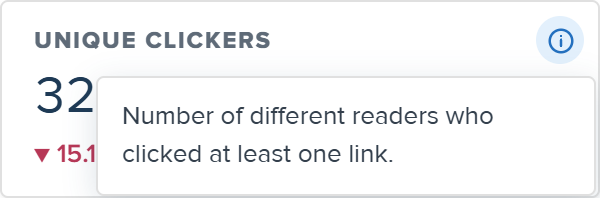
One definition for every metric

Unique clickers tooltip: number of different readers who clicked at least one link
CTR tooltip: link clicks divided by page views of the pages the links were on
Page views tooltip: how many times the page was viewed in this date range
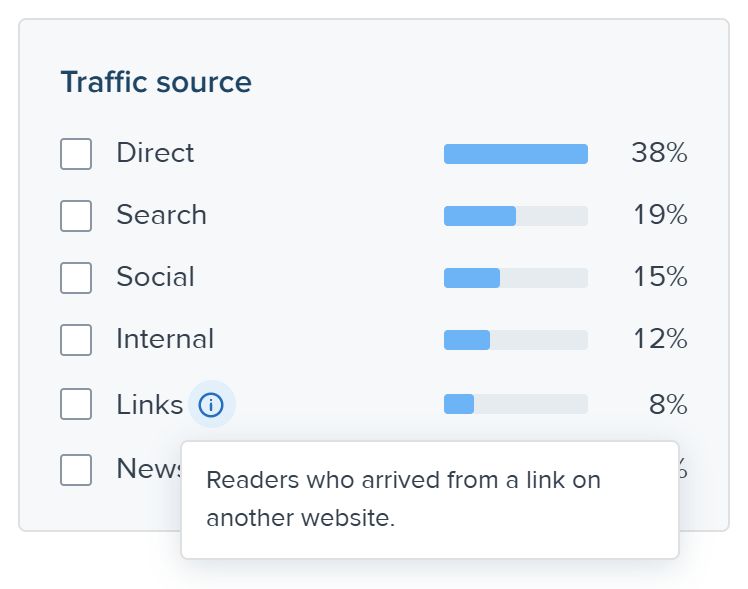
Links traffic source tooltip: readers who arrived from a link on another website
Comparison tooltip: change in link clicks compared with last Wednesday

A note on why totals differ

Note under the KPI cards: clicks are counted on your site, so totals may differ from merchant or affiliate dashboards

Badges that explain why a link was tagged

Affiliate badge popover: tagged as affiliate because it matches amazon.co.uk in your affiliate domains, with a Manage link
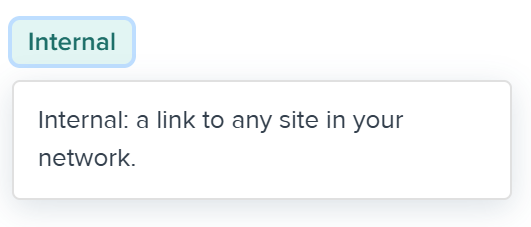
Internal badge popover: a link to any site in your network
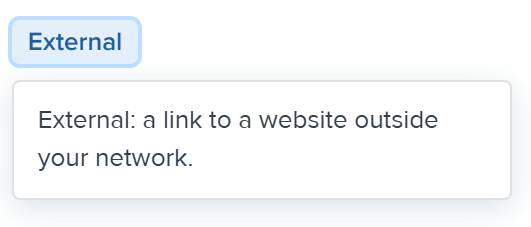
External badge popover: a link to a website outside your network

06Testing and iteration

Five rounds. The biggest changes came from watching clients use it.

How it evolved

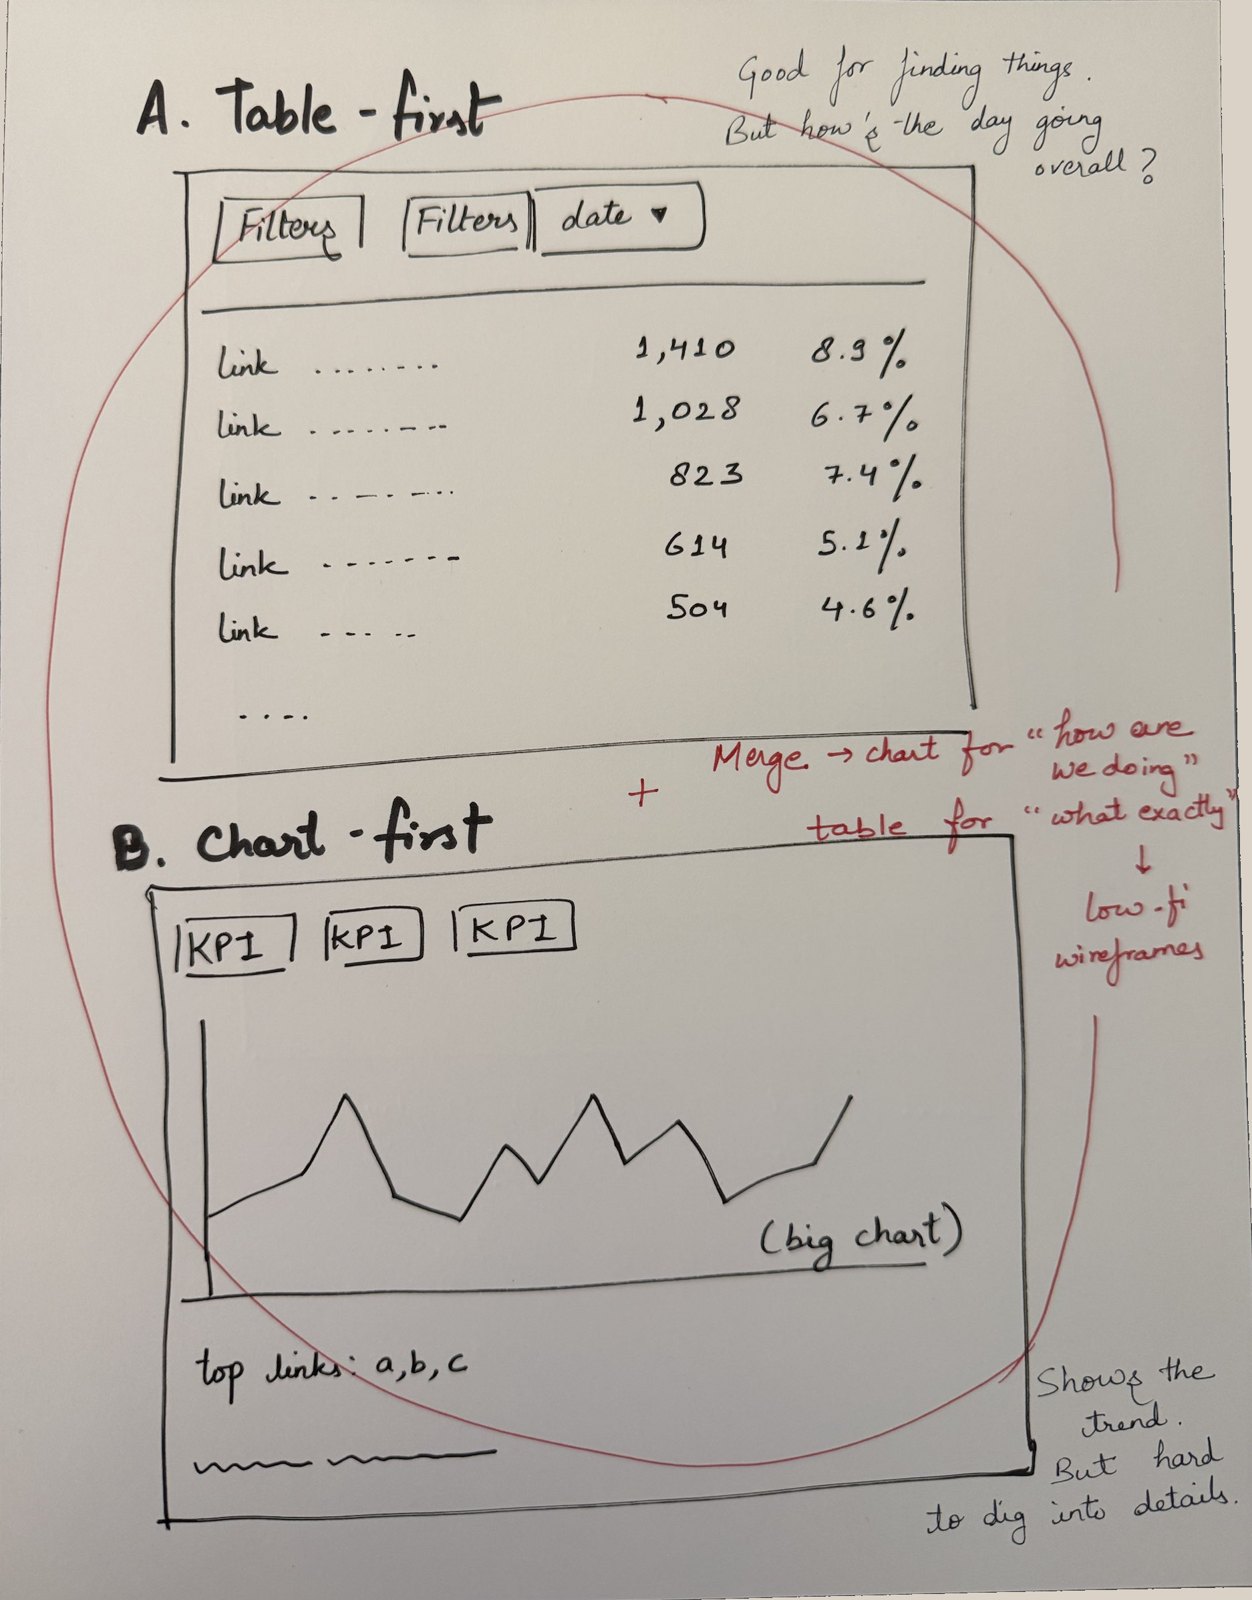
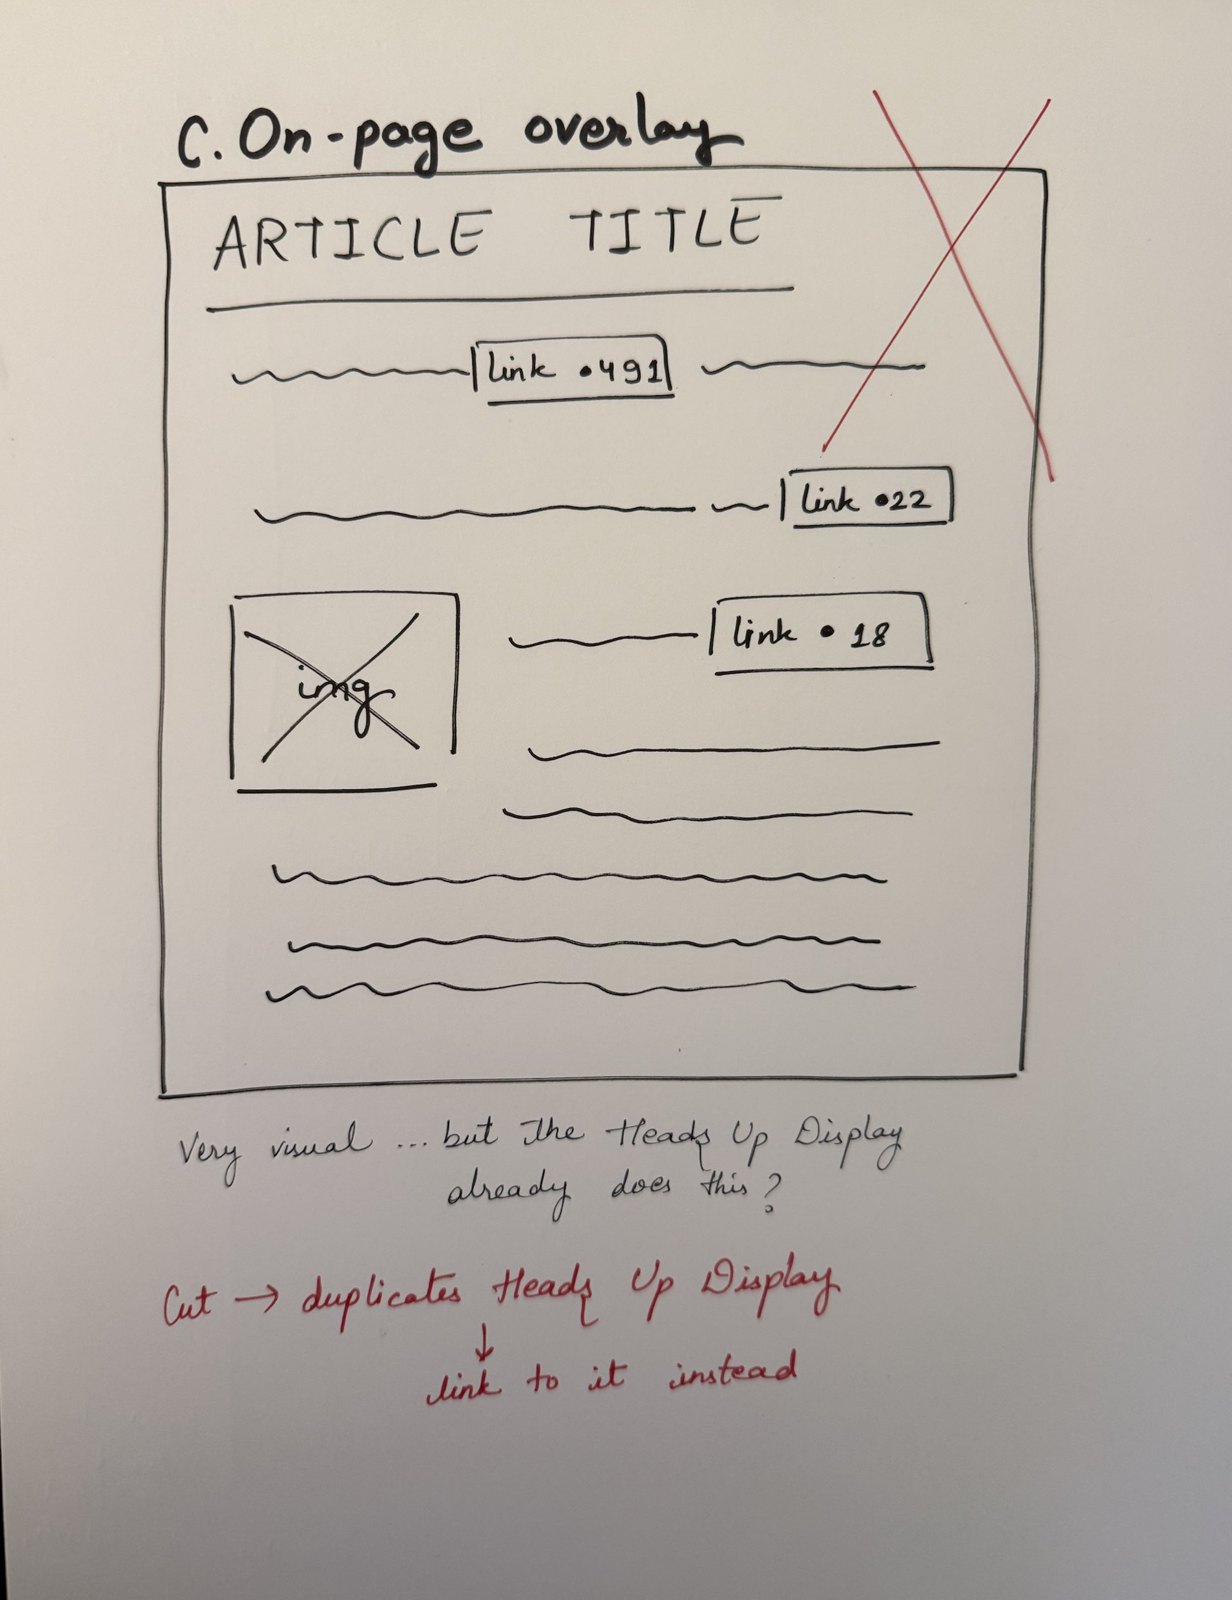
  1. Paper sketch: A, table-first and B, chart-first, circled in red with the note: merge, chart for how are we doing, table for what exactly, then low-fi wireframesPaper sketch: C, on-page overlay with link counts on an article, crossed out in red: cut, duplicates Heads Up Display, link to it instead
    01

    Sketches

    Table-first, chart-first, on-page overlay. Overlay cut: it duplicated the Heads Up Display.

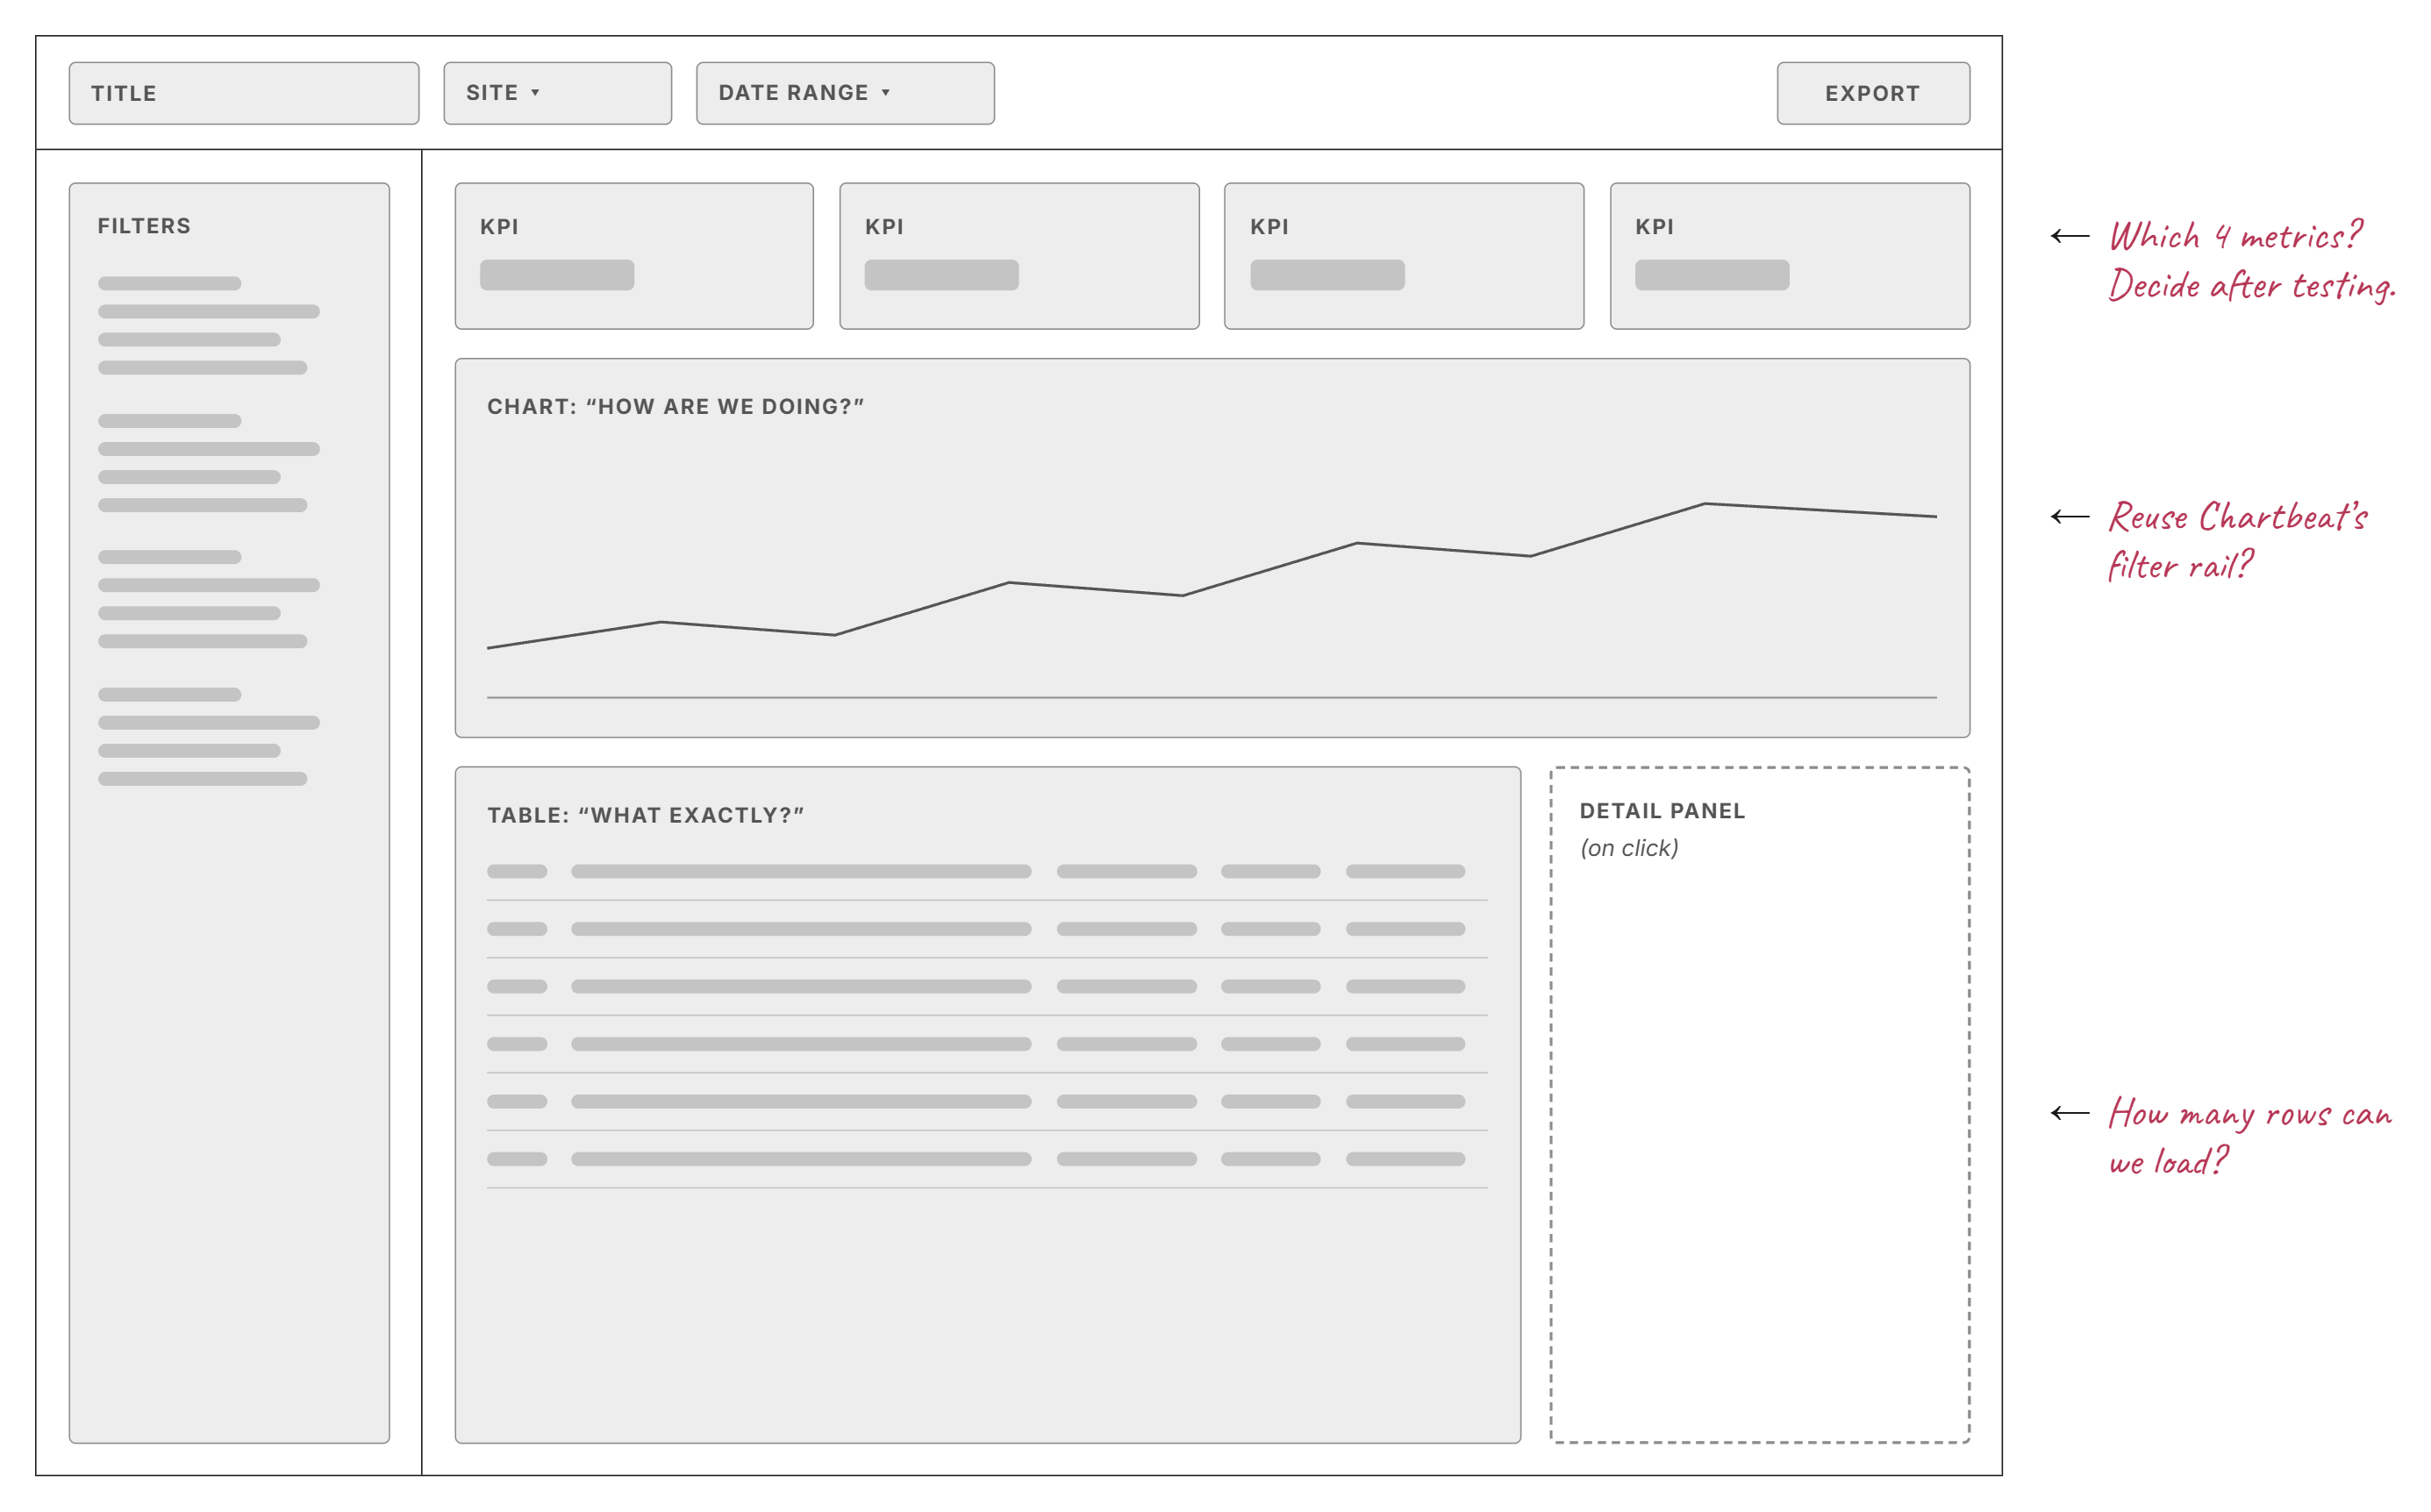
  2. Low-fi wireframe: title, site and date range controls, filter rail, four KPI boxes, a chart for how are we doing, a table for what exactly, and a detail panel on click, with handwritten notes: which 4 metrics, reuse Chartbeat's filter rail, how many rows can we load
    02

    Low-fi wireframe

    A chart for “how are we doing”, a table for “what exactly”.

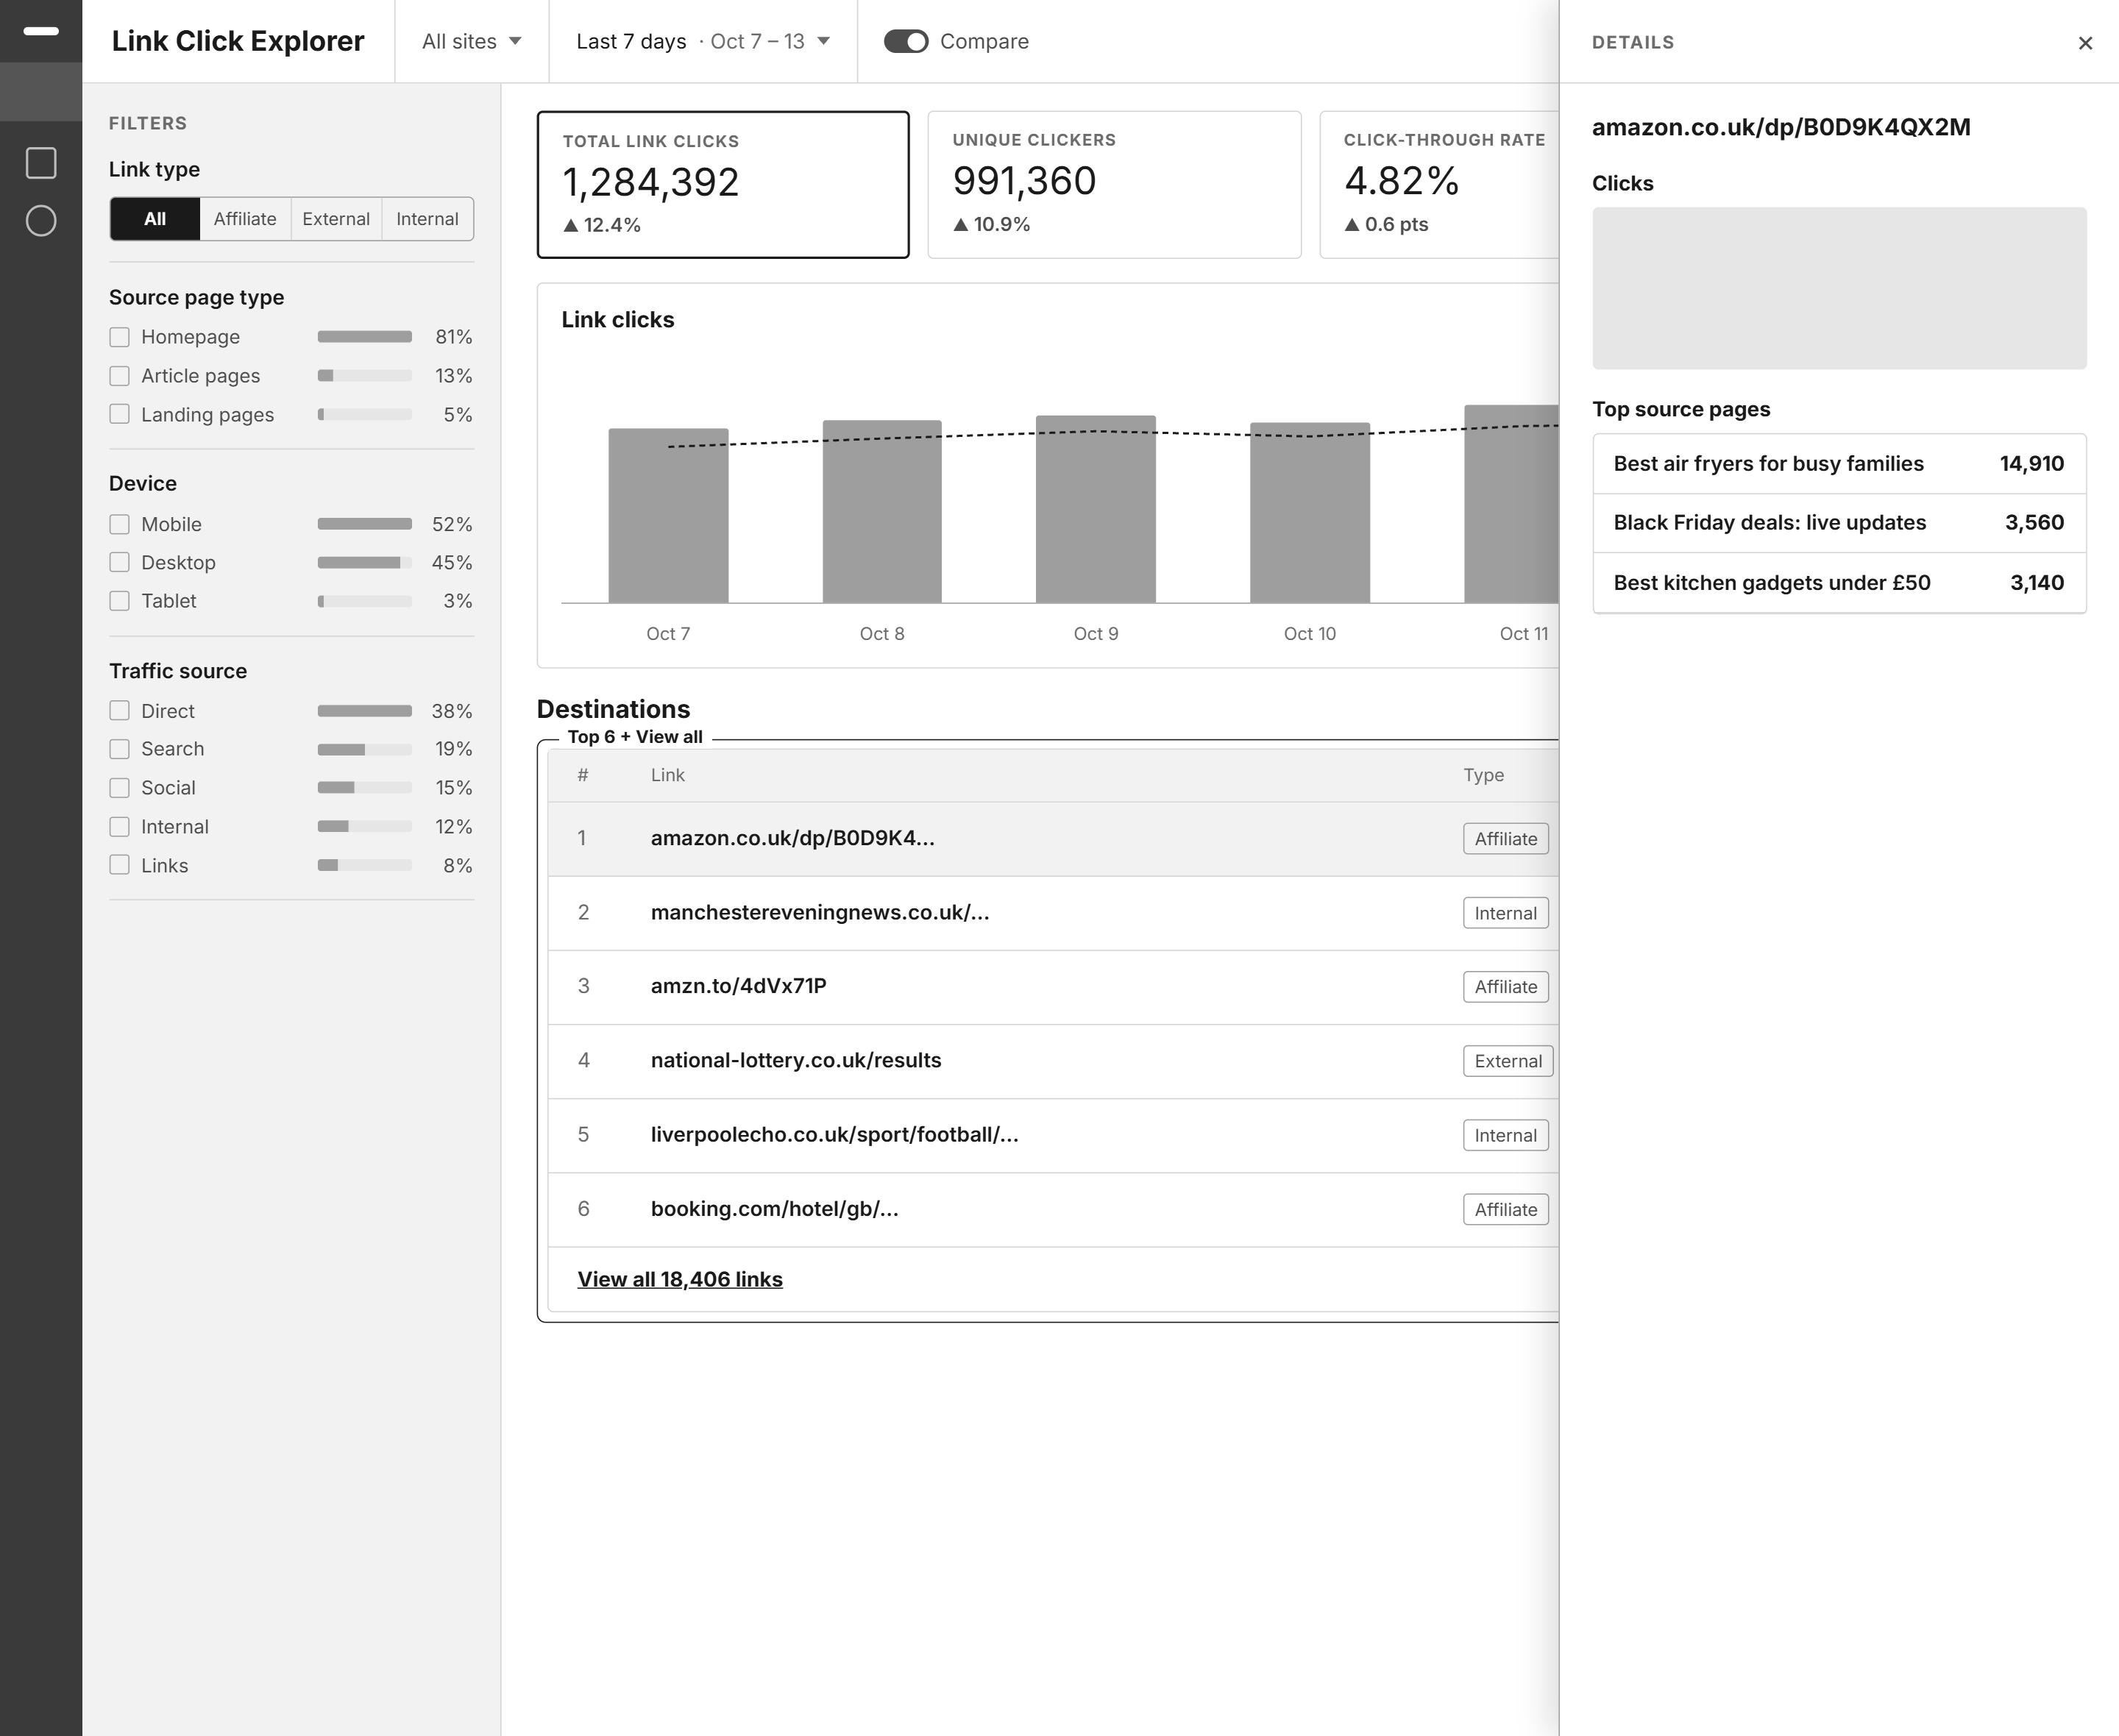
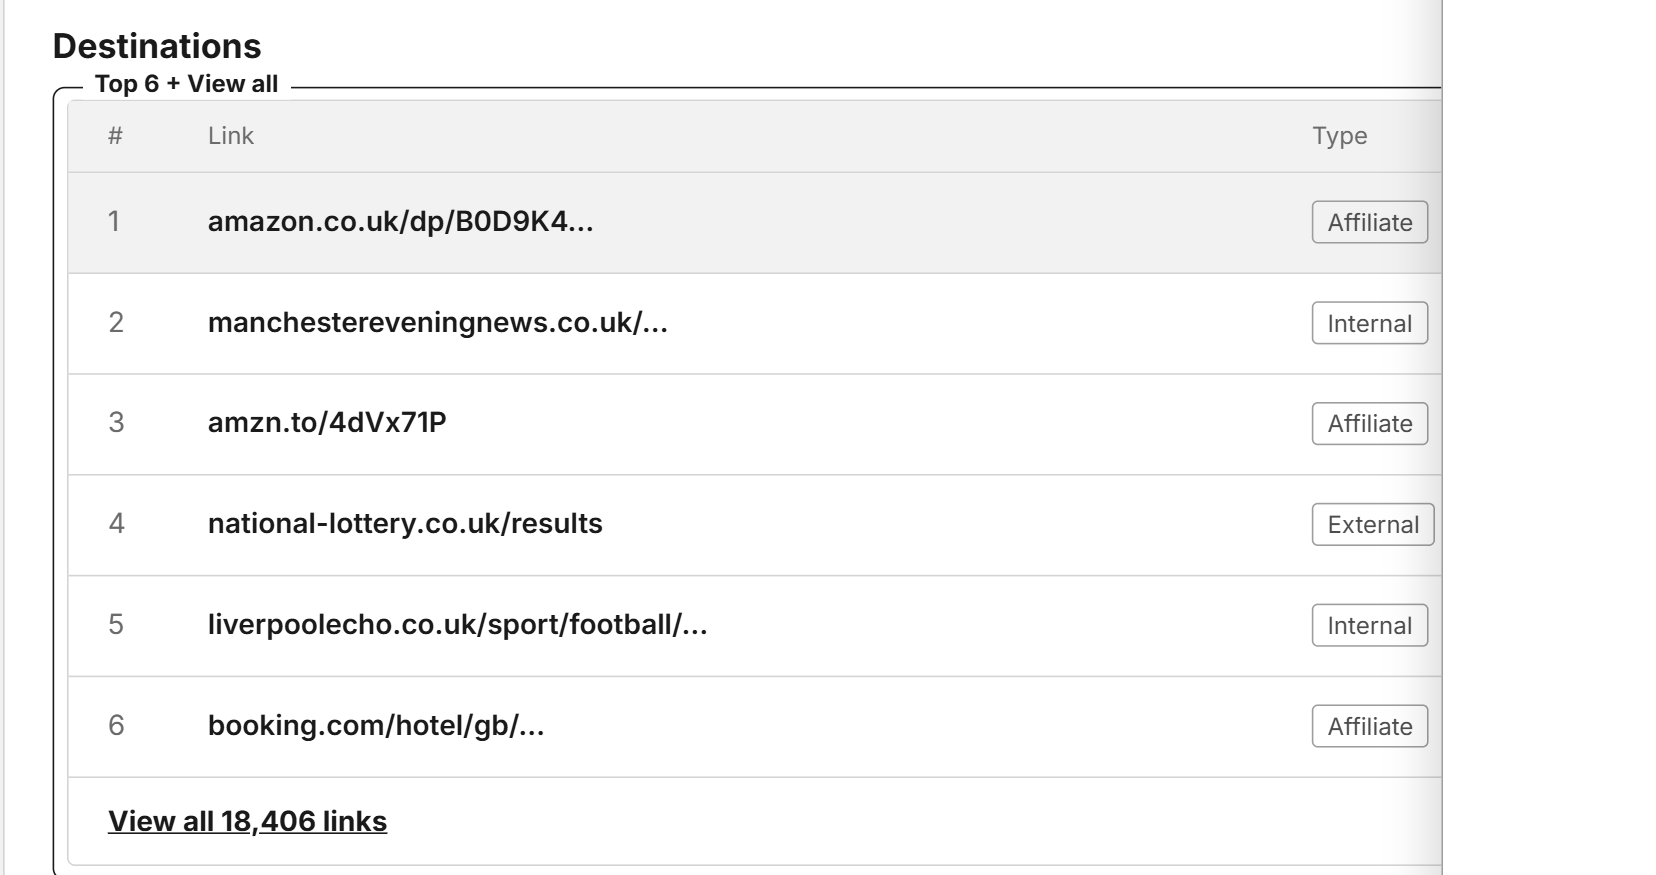
  3. Mid-fi v1 in greyscale: Last 7 days view with KPI cards, a daily chart, a Destinations table with Top 6 plus View all, and a Details panel
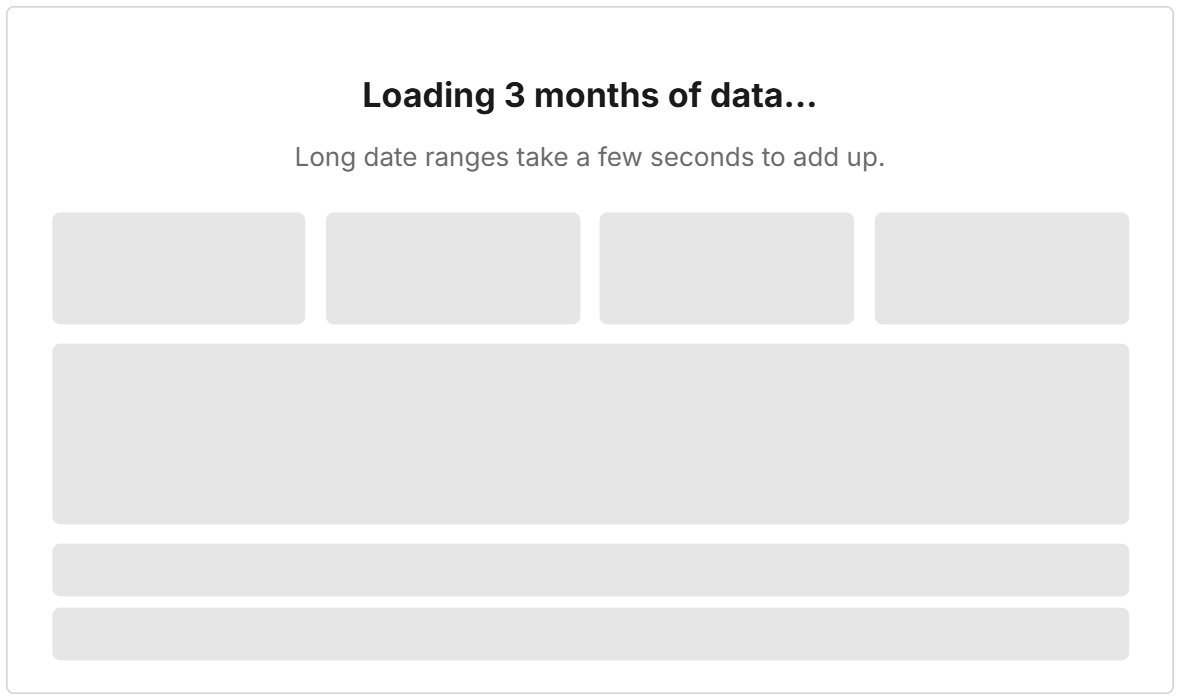
    v1 loading state: Loading 3 months of data, long date ranges take a few seconds to add up
    03

    Mid-fi v1

    After engineering review: “Top N + View all” instead of 18,000 rows.

  4. v2 Link Click Explorer in greyscale, with the Link details panel open
    04

    v2 after testing

    Two big changes from client sessions, shown below.

  5. Final Link Click Explorer screen
    05

    Final

    Design system applied, plus states, edge cases and accessibility.

Before → after 01

Articles, not links

Before
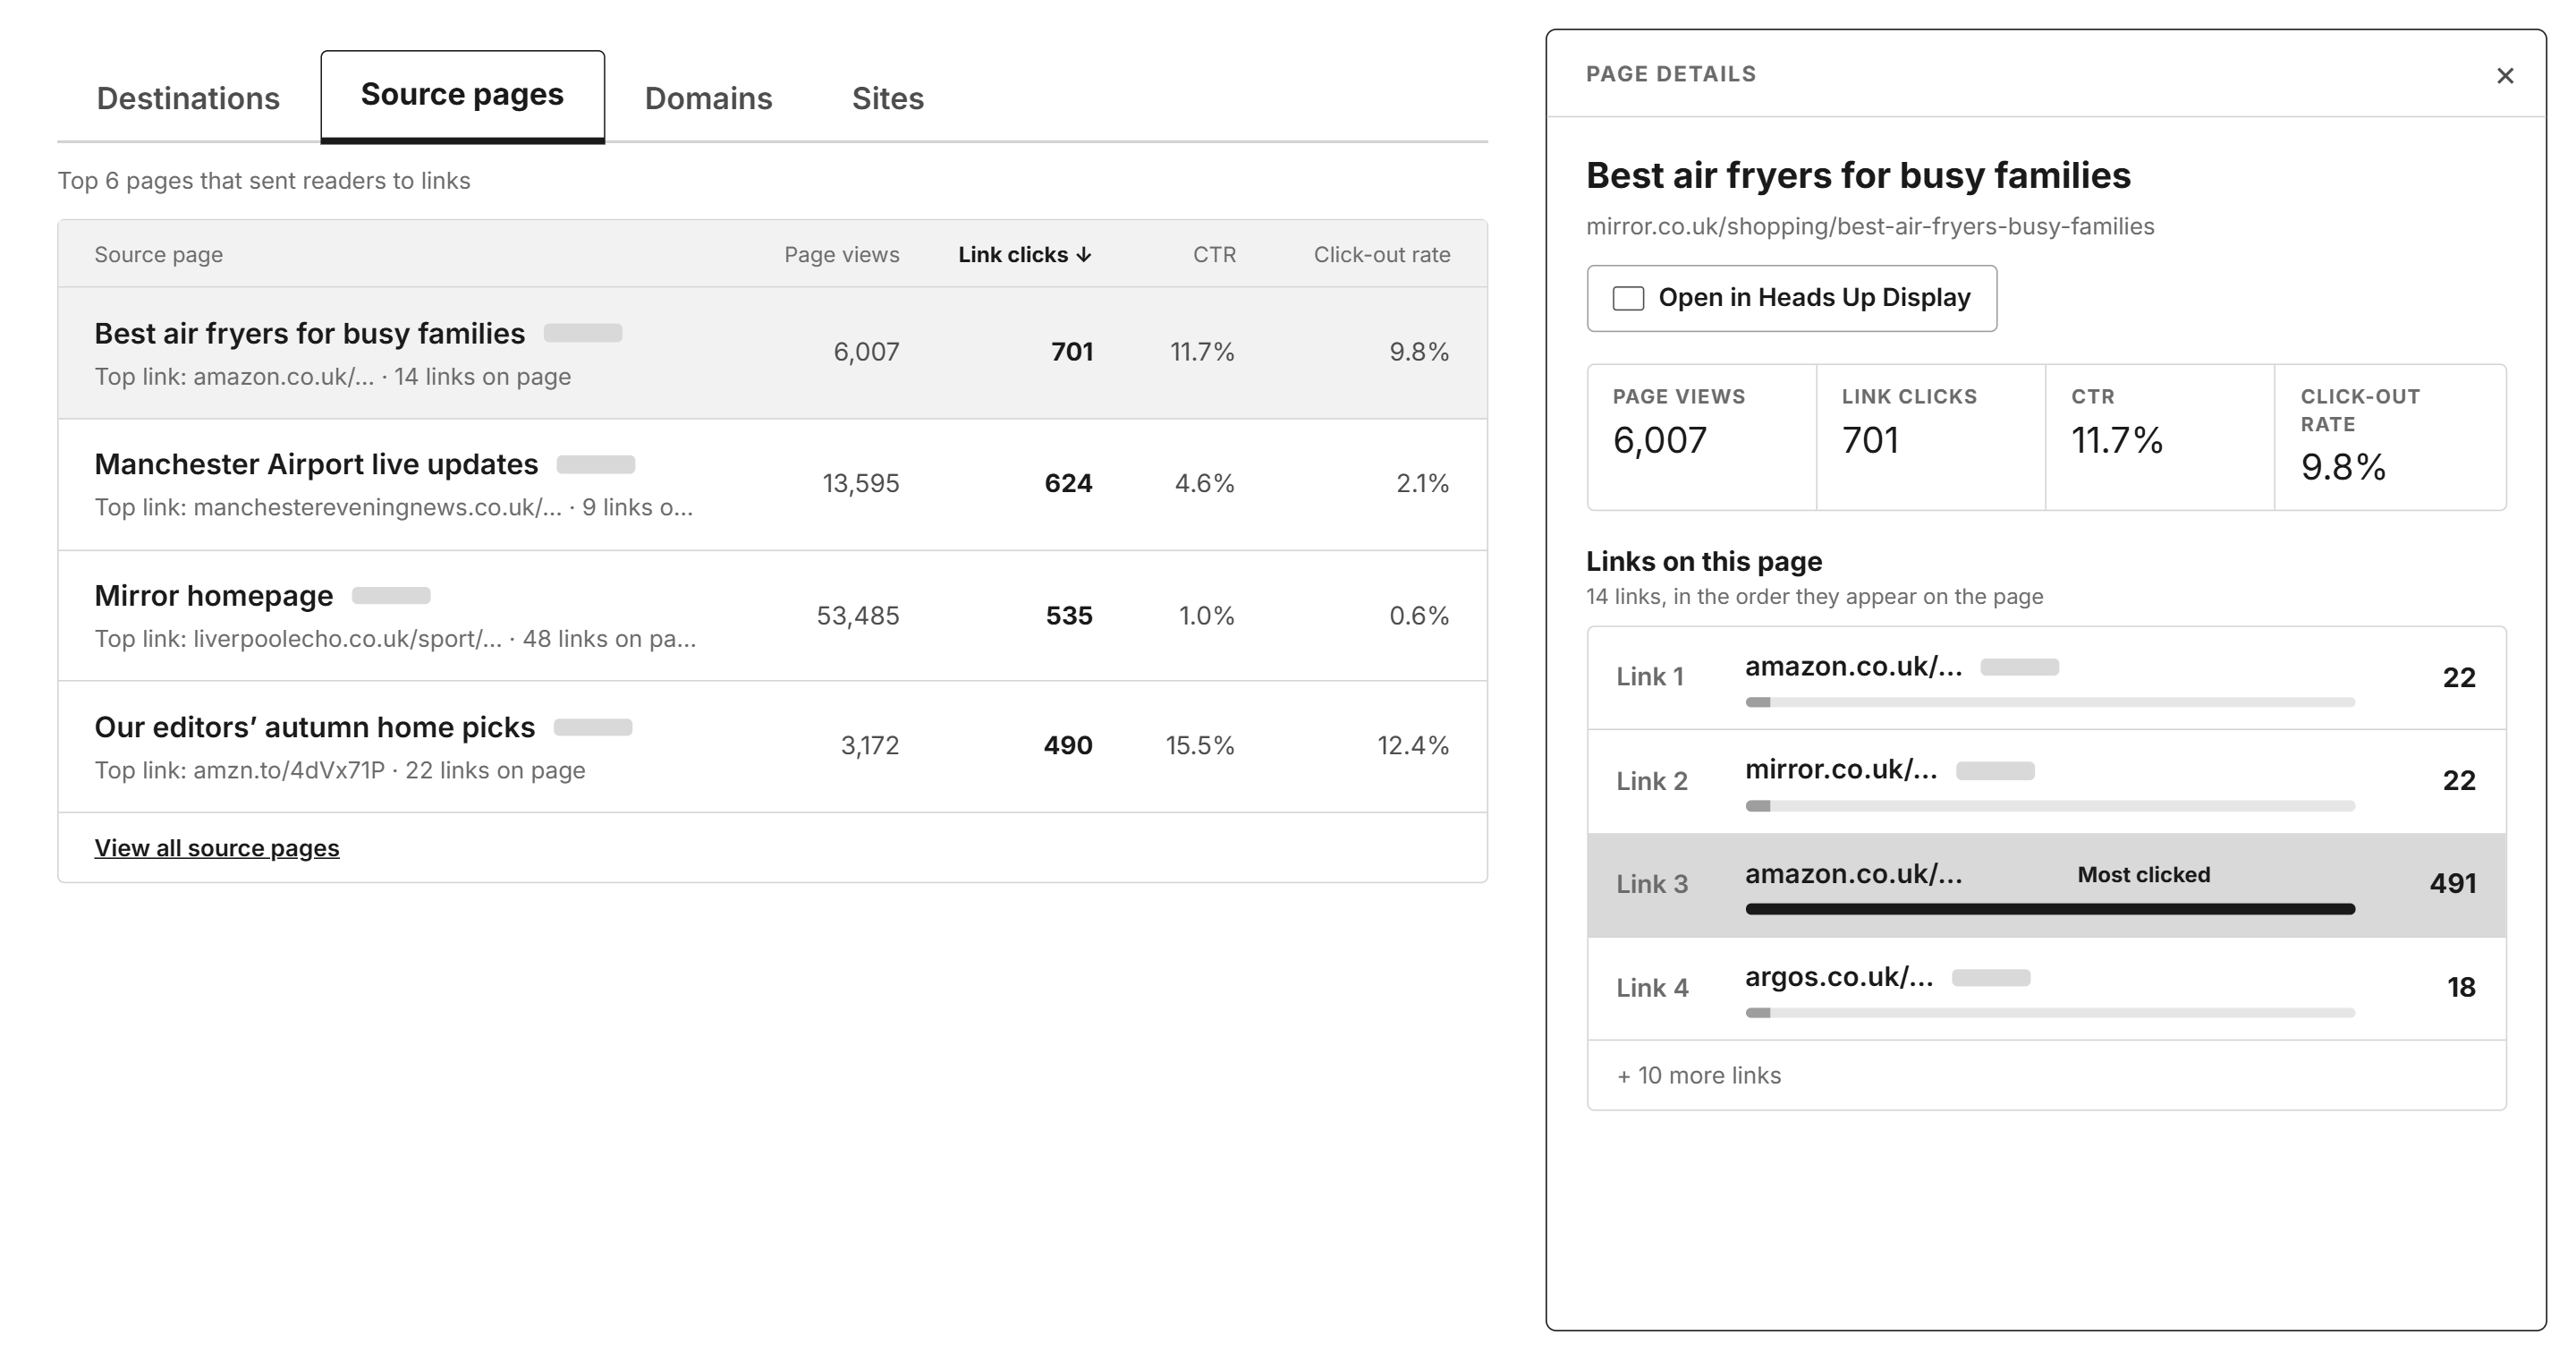
v1: one Destinations table listing raw URLs, Top 6 plus View all. Source pages only appear inside the drill-down panel.

What we saw

The affiliate manager kept looking for his article titles, not URLs.

After
v2 Source pages tab: one row per article with page views, link clicks, CTR and click-out rate, plus the Page details panel showing every link on the page

Plus a Page details panel that lists every link on the article.

Before → after 02

“Is this today or the week?”

Before
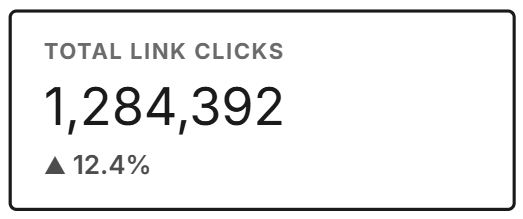
v1 KPI card: Total link clicks 1,284,392, up 12.4%, with no time period shown

What we saw

A tester read a weekly total as today’s number.

After
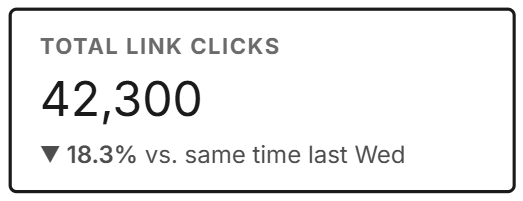
v2 KPI card: Total link clicks 42,300, down 18.3% vs. same time last Wed

Plus dates in every chart title, and “Updated 3 min ago”.

07Final design

One day with Link Click Explorer

Follow an affiliate manager from the morning check to fixing a slow afternoon.

  1. 1Wed · 9:00am

    Morning check

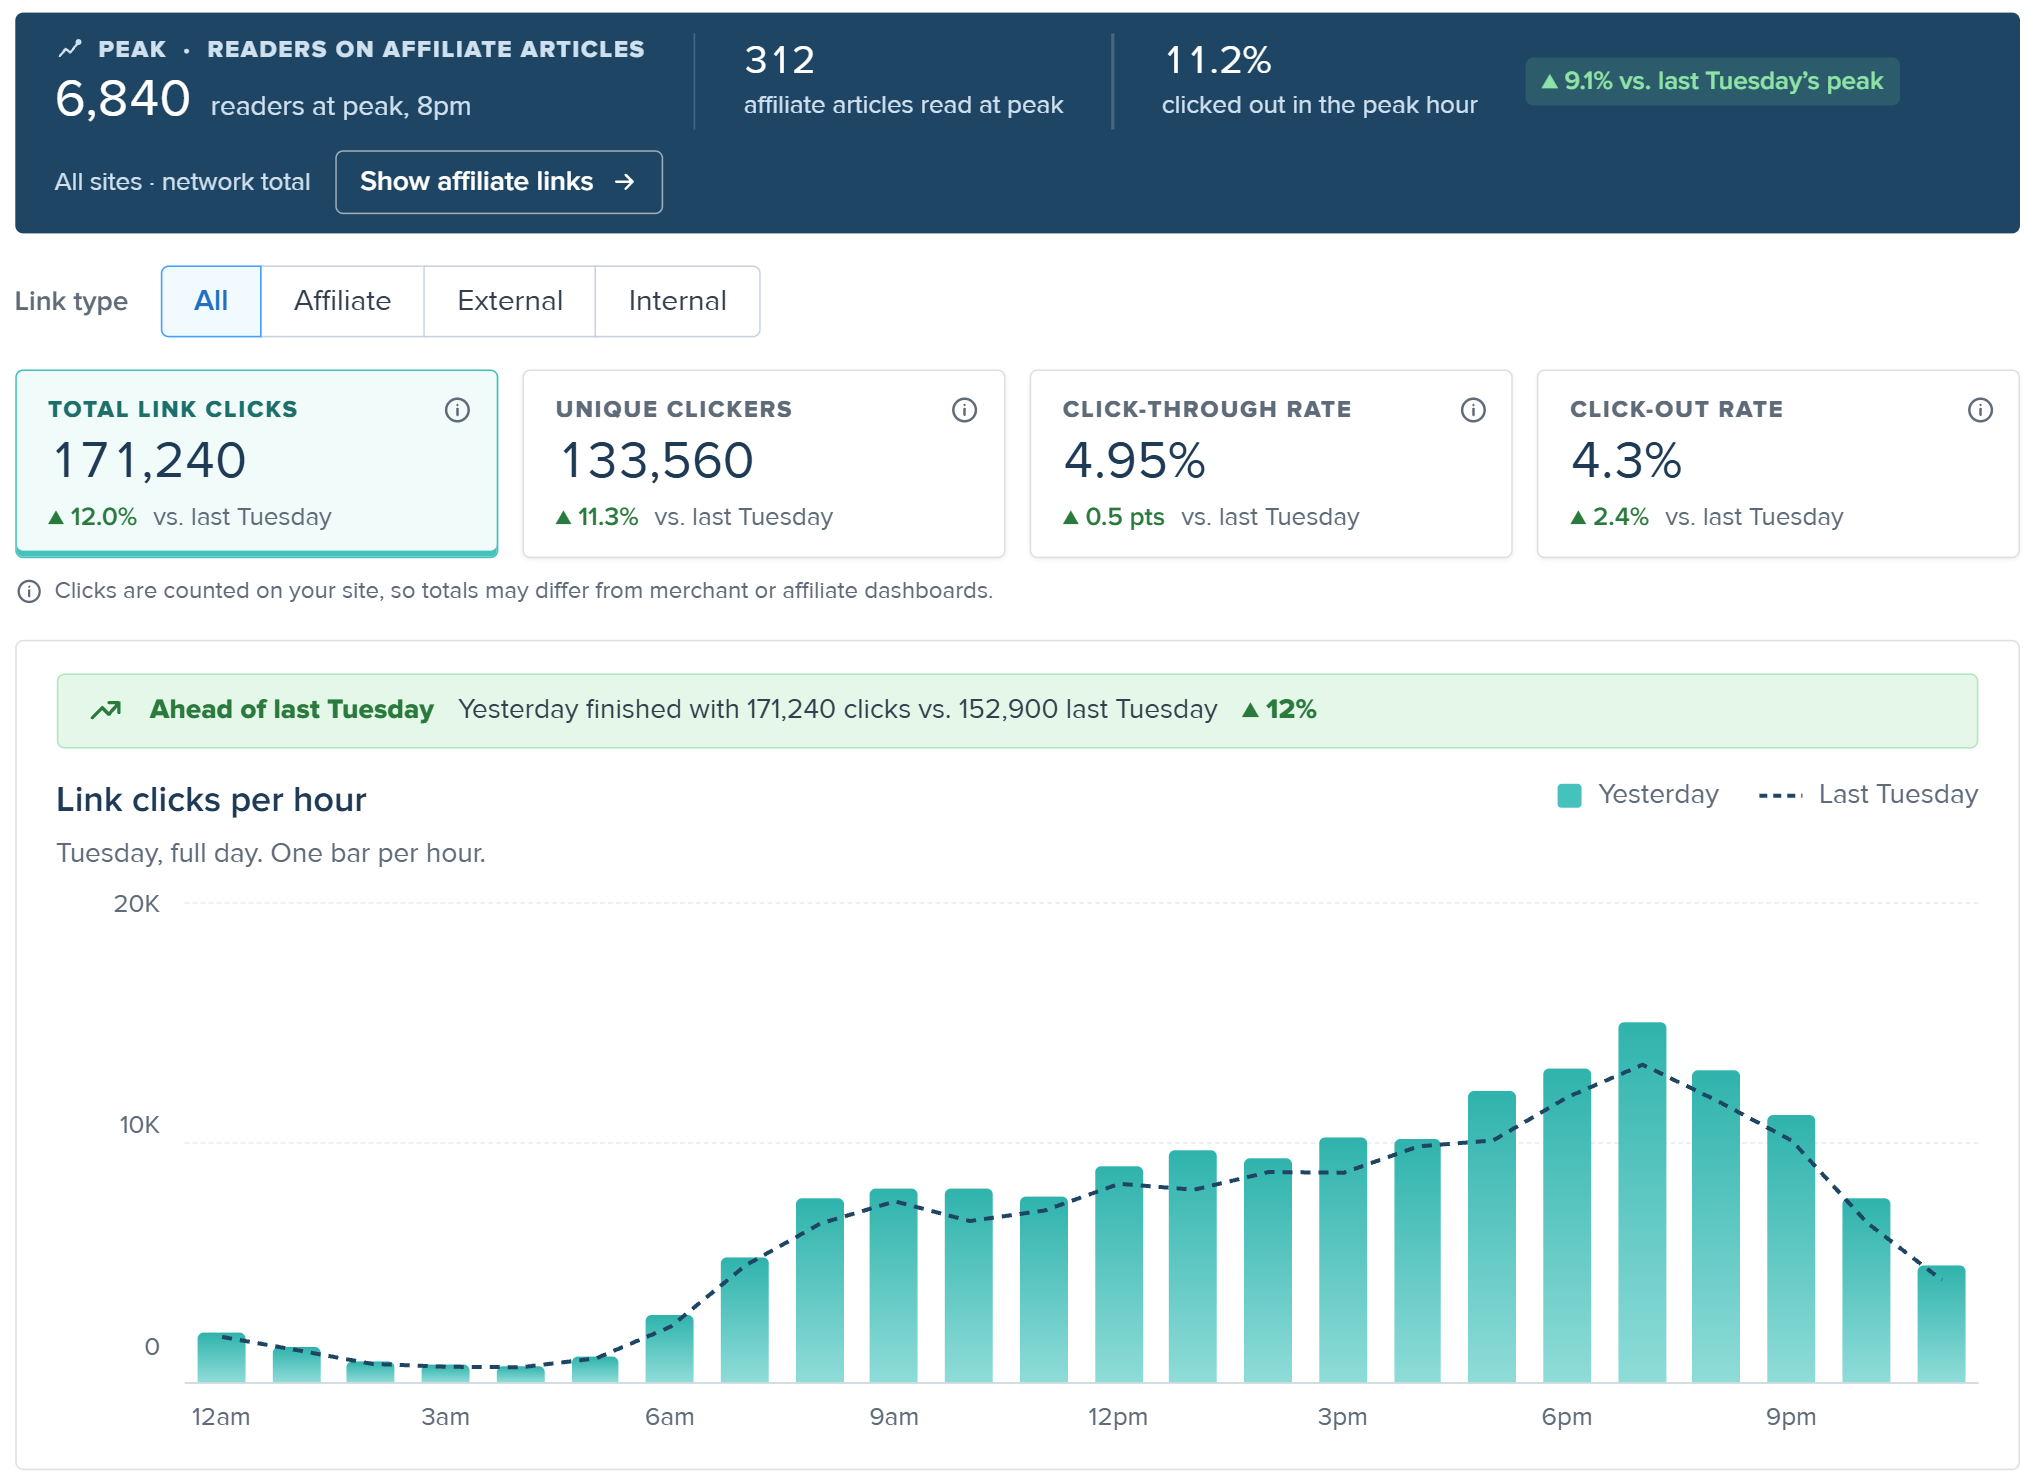
    She opens Yesterday. One green line tells her Tuesday beat last week by 12%. Job well done.

    Yesterday view: peak of 6,840 readers on affiliate articles, 171,240 link clicks up 12% vs last Tuesday, a green Ahead of last Tuesday banner, and the full-day hourly chart
  2. 2Wed · 2:00pm

    Spot a drop

    Back on Today, the banner turns red: 18% behind this time last week. 4,012 people are reading affiliate articles right now.

    Today view: 4,012 live readers on affiliate articles, link click totals, a red Behind pace banner, and the hourly chart with the Now line
  3. 3Wed · 2:05pm

    Find the cause

    She sorts Source pages and opens her top article. The best link is third on the page. The first link barely gets clicked.

    Links on this page, in page order: Link 3 is the most clicked at 491, while Link 1 has 22
  4. 4Wed · 2:10pm

    Act on it

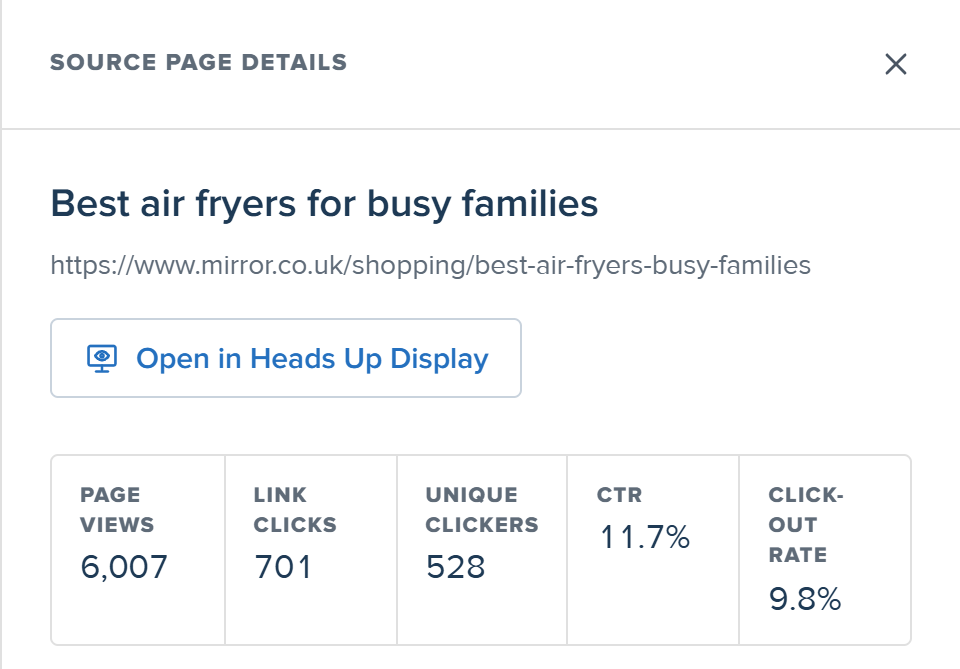
    She opens the article in the Heads Up Display to see the clicks on the page, then moves the best link higher.

    Source page details header with the Open in Heads Up Display button highlighted

The other user, in 3 steps

A data analyst’s quarterly report

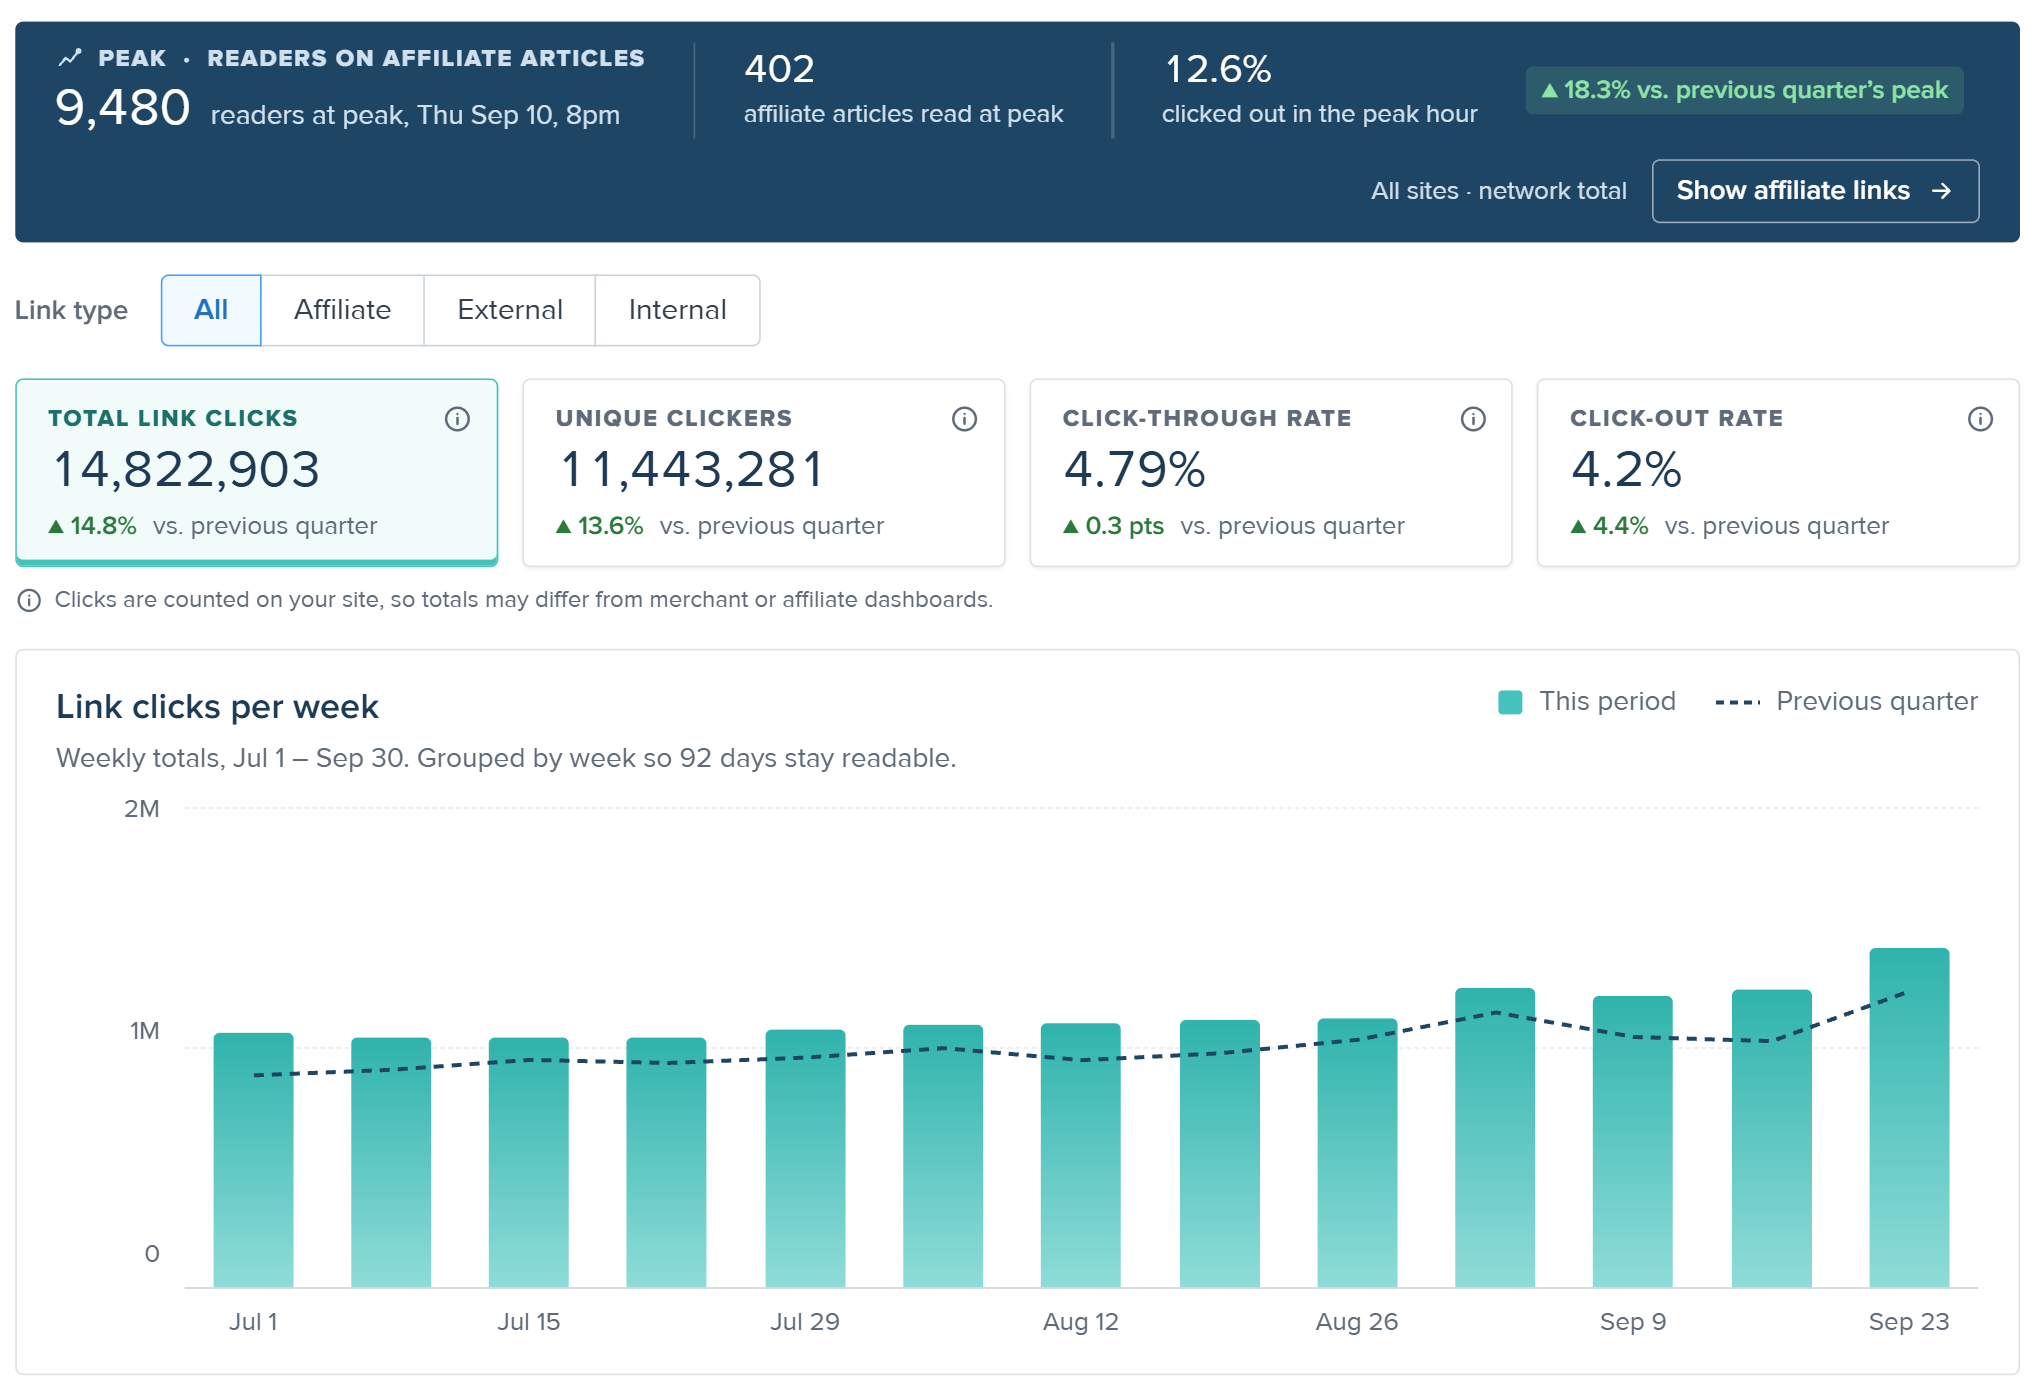
  1. Quarter view: last quarter Q3, Jul 1 to Sep 30, 14,822,903 link clicks up 14.8% vs previous quarter, and weekly bars compared with the previous quarter

    Pick last quarter

    Q3 with weekly bars, compared to the quarter before.

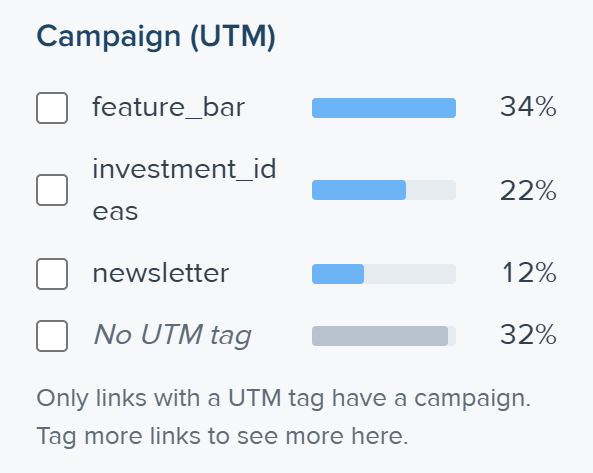
  2. Campaign (UTM) filter in the left rail: feature_bar 34%, investment_ideas 22%, newsletter 12%, no UTM tag 32%

    Filter by module

    UTM filter: feature_bar, to see what the feature bar really added.

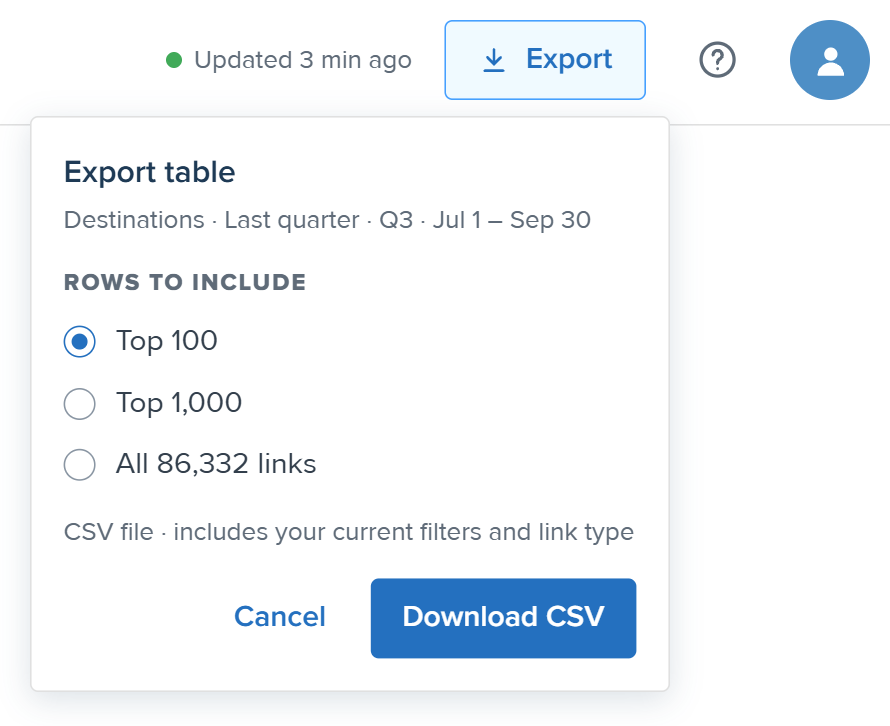
  3. Export popover: export the Destinations table for last quarter, with Top 100 selected, and a Download CSV button

    Export the top 100

    One click to share with the team, no SQL needed.

08Outcome

Shipped to beta clients, with a clear way to measure success.

Status
Handed off to engineering, then shipped to beta clients.
Concept tested with
Reach and Yahoo Finance, using the v1 prototype
Delivered
Final designs, specs, a metric definitions doc and a v2 backlog

How we’ll know it worked

  1. 01

    Weekly use affiliate and data teams open the page every week

  2. 02

    Fewer manual requests customer success stops pulling click reports by hand

  3. 03

    Same-day answers “which article drove clicks?” takes minutes, not a wait for partner data

  4. 04

    Today view in use teams check pacing during the day, not just the next morning

Before I left

A usability testing plan for the final design

Tasks and success criteria for sessions with the same clients, being scheduled as I wrapped up.

A handover doc

Open questions for the team: how to detect affiliate articles, how authors map to teams, and revenue for v2.

09Reflection

What I’m taking into my next project

01

Ask what the data can do before drawing

One conversation with a backend engineer changed more of the design than any sketch. Now I start there.

02

A good “no” leaves room for “later”

Cutting revenue was hard. Designing a space for it turned the no into a “not yet” the team could plan around.

03

Test the final, not just the concept

Concept tests on v1 changed the design the most. Next time I’d plan time for usability testing on the final design before handoff.

What v2 would add

Usability testing on the final design Estimated revenue per click Alerts when one merchant gets too much traffic Author and team comparison

Thanks for reading.

Next case study: Chartbot