All work

Chartbot · Chartbeat

Do users even want an AI chatbot? Researching Chartbot before we built it

Chartbeat wanted to add an AI chartbot to its analytics platform. I helped lead mixed-methods research with newsroom users across 8+ countries to understand what they would actually ask it and what it would take for them to trust it

Role
UX Research
Team
UX Research Lead, Product Manager. Product Designer, Engineering
Methods
Desk research, stakeholder interviews, in-product survey (Pendo), 14 user interviews, affinity mapping
300+survey responses
14interviews
8countries

What changed

  1. Key shift: from “help bot” → “explain my data” tool
  2. Defined trust as a core requirement: answers must show where they came from
  3. Gave engineering 60+ real user questions to test the AI’s accuracy

01Context and the problem

The product

Chartbeat helps newsrooms around the world understand what readers are paying attention to, in real time.

Editors use it to decide which stories to push, often within minutes of breaking news. That means our users make fast, high pressure calls and they need to trust what they see.

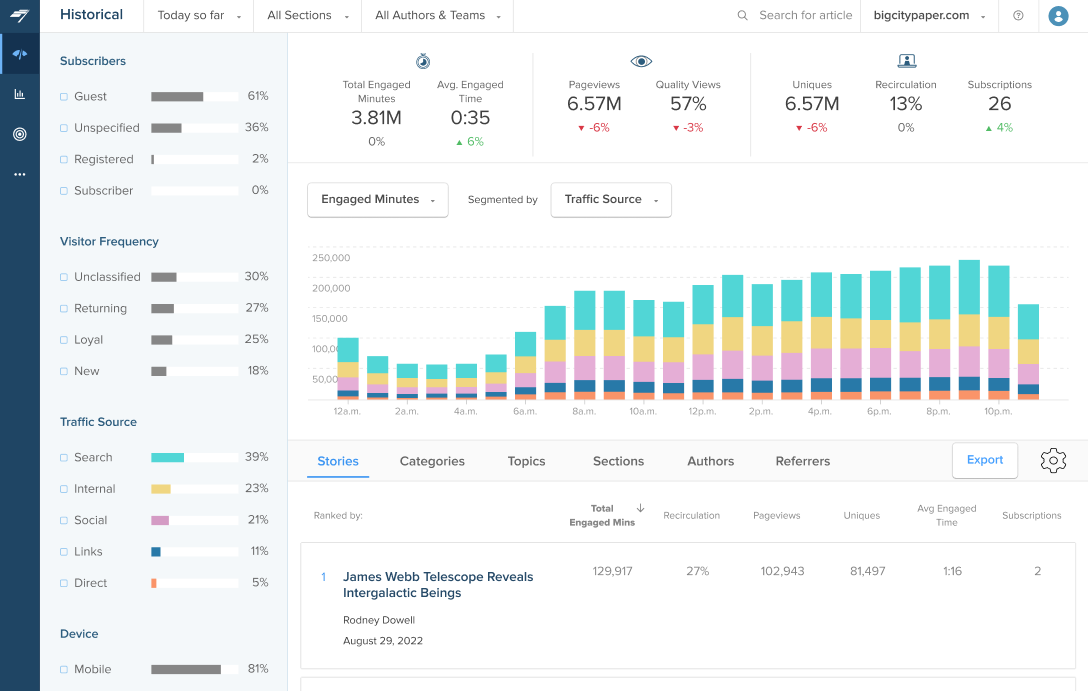
Chartbeat's historical dashboard, showing engaged minutes, pageviews and traffic sources

The push

The company wanted to add an AI chatbot, Chartbot, to the product. The reasons made sense:

Repeat support questions

customer success kept answering the same questions

Data confidence

not every user felt sure about reading their numbers

One platform

after merging with Tubular, Lineup and FatTail, users needed one place to get answers

The real question

The industry

“Everyone is adding AI.”

vs.

Our question

“What do our users actually need?”

We didn’t know:

Do they want a chatbot at all? What would they ask it? Would they trust it when it matters most?

Our job: find out before we built it.

02My role

I worked under our UX Research Lead as the only other researcher on the project. Over 10 week, I went from taking notes to leading interviews and synthesis myself.

I led

  • Survey analysis
  • Recruiting screener
  • 10 of 14 interviews
  • Question bank for AI testing

Co-led with my lead

  • Survey design
  • Interview guide
  • Synthesis and final insights

Supported

  • Research goals with PM
  • Survey Placement
  • Leadership readout (I presented insights)

How my role grew

Weeks 1-3

Taking notes

Desk research, shadowing my lead’s calls

Weeks 4-6

Co-running calls

Survey analysis, screener, first interviews together

Weeks 7-10

Leading interviews

Running sessions, leading synthesis, presenting insights

Worked with
UX Research LeadProduct ManagerProduct DesignerEngineering

I invited the PM and designer to observe interviews, so findings felt shared, not handed over.

03Research goals and approach

Before picking methods, we agreed on what we actually needed to learn.

What we needed to learn

Q1

What do users ask?

What questions come up while using Chartbeat and where do people go for answers?

Q2

“How” or “why”?

Any questions about using the tool or about what the data means?

Q3

How do roles differ?

What do editors, analysts and ad ops each need from an answer?

Q4

What builds trust?

What should make them trust or stop trusting, an AI answer about their data?

How we learned it

A survey for breath, interviews for depth. Each covered the other’s blind spot.

Step 1 · Desk research

What problems already exist?

Support tickets, help center searches and talks with customer success, so we didn’t start from zero.

Tickets · CS · Pendo analytics

Step 2 · In-product survey

What do people ask and how often?

Researched real users inside Chartbeat, across countries, in under 2 minute

300+ responses · Pendo

Step 3 · Interviews

Why and how does it feel?

The stories behind the number

14 users · 8 countries

The survey’s last question recruited interviewees, so we talked to real, active users

What we chose not to do

Usability testing

There was nothing to test yet. A mockup would have measured reactions to a design, not real needs.

Analytics alone

Usage data showed where people got stuck, not what they were trying to understand

“Would you use it?”

People say yes to hypotheticals. We asked about their last real question instead.

04Process highlights

Four small decisions that shaped what we learned. Most of the process was standard. These are the moments where a judgment call made the difference

01

Protect the breaking-news moment

Situation

The easiest place for a pop-up survey was the main screen, the real-time dashboard.

The call

We kept it off real-time and showed it on historical views instead. When responses were low, we moved the trigger earlier.

Why it mattered

No editor was interrupted mid-story and we still got 300+ responses.

Real-time dashboardBreaking news, decisions in minutes
No survey
Historical dashboard and reportsReflective, slower work
Survey here
02

Ask about the past, not the future

Situation

My first draft had 12 questions, some asking people to imagine the future.

The call

We cut to 6 and rewrote hypotheticals into real, recent behavior.

Why it mattered

We learned what people actually ask, not what they imagine they would

Before12 questions

“How helpful would an AI assistant be for you?”

Leading and about an imagined situation

After6 questions

“Think about the last time you had a question while using Chartbeat. What was it”

Open and about something that reallyhappened

03

Recruit skeptics on purpose

Situation

The longest, most excited survey answers came from AI fans and I picked mostly them at first

The call

My lead caught it. We rebalanced across roles, regions, newsroom sizes and attitudes toward AI

Why it mattered

Skeptics gave us our biggest insight: one wrong answer during breaking news and they would never use it again.

14 interviewees, by attitude to AI

Excited
Neutral
Skeptical
Also balanced by
RoleRegionNewsroom size
04

When users are confused, don’t help. Watch.

Situation

In an early interview, a participant got stuck on a metric, and I jumped in to explain it.

The call

I learned to pause and ask what they expected instead.

Why it mattered

Their confusion was the data. It showed which terms Chartbot would need to explain.

Instead of explaining

“Oh, that metric just means…”

I started asking

“What did you expect it to mean?”

05Key insights

We went in asking how to build a chatbot. We came out knowing what it needed to be.

Insight 01 · The biggest shift

Answers Q1 · What users askQ2 · “How” or “why”

People ask “why,” not “where”

Questions users wrote in the survey, by type

“I don’t need help finding a button. I need to know why traffic dropped at 3pm.”
Audience editor, UK

So what

Chartbot’s main job is explaining changes in the data, not acting as a help bot.

Insight 02

Answers Q4 · Trust

One wrong answer ends trust for good

11/ 14participants,
including every skeptic
“If it tells me something wrong during breaking news, I’m never opening it again.”
Homepage editor, Australia

So what

Every answer shows its source, and Chartbot says “I’m not sure” instead of guessing.

Insight 03

Answers Q3 · Roles

Same question, different depth

“Give me one line. I’ve got 30 seconds.”

Editor, US

“Show me the breakdown. I’ll dig in myself.”

Data analyst, Germany

So what

Lead with a short answer, then let people expand for detail. One design serves both.

Insight 04

Answers Q4 · Trust

Stay out of the way

8/ 14participants
“That dashboard is on a TV in the newsroom. A chat window popping up on it would be a disaster.”
Newsroom manager, Brazil

So what

Chartbot opens only when asked. No pop-ups, and it hides in big-screen mode.

Also heard

Privacy: worry about data training AI Language: ask in their own language Sharing: send answers to Slack or email

06Impact

The research didn’t just inform Chartbot. It changed what Chartbot was.

The big shift

Before research

A help bot

“Where do I find the export button?”

Answers how-to questions and reduces support tickets.

After research

A data explainer

“Why did traffic drop at 3pm?”

Explains why the data changed, and shows its sources.

What each team did with it

Product

Roadmap reordered

“Explain my data” moved ahead of help-center answers.

Sources became a must

“Shows its sources” turned into a launch requirement.

Design

4 design principles

Used to review every Chartbot concept.

  1. 01Explain, don’t just point
  2. 02Show your sources
  3. 03Short first, detail on demand
  4. 04Open only when asked

Engineering

60+

real user questions used to test whether the AI’s answers were right

“I’m not sure” added

For questions the model couldn’t answer confidently.

What the research stopped

A chat that pops up on its own

Users said it would get in the way during breaking news.

Launching as a help bot first

That would have solved the smaller problem.

Chartbot on newsroom TVs

It now hides in big-screen mode.

What happened next

My internship ended as the design phase started, so I didn’t see launch numbers. What I could see: every concept the team reviewed was checked against the four principles, and customer success started using our findings in onboarding calls.

07Challenges and what I learned

What I got wrong, and what it taught me

Three mistakes that made me a better researcher.

01

Memorable isn’t the same as common

1/ 14

One vivid quote

11/ 14

A real pattern

What happened

During synthesis, I treated one striking quote as a major theme. My lead asked how many people said it. It was one.

What I learned

Count before you claim. Now every insight carries how many people said it.

02

I filled every silence

What happened

In early interviews, when a participant paused, I jumped in. They’d just agree with whatever I said.

What I learned

The best answers come after the pause. I count to five before speaking.

03

Plain English travels further

Before

“Walk me through how you’d ballpark recirc on a slow news day?”

After

“How do you check if readers click to a second story?”

What happened

With participants across 8 countries, I spoke fast and used idioms and internal jargon. Some answers missed the question.

What I learned

Slow down, skip idioms, and use the user’s words, not ours.

If I did it again

Bring engineering in earlier

The question bank became their favorite output. They should have helped shape it from day one.

Pilot with an international user

Our survey pilot was all US-based. One non-US tester would have caught the jargon sooner.

Plan how to measure success

Agree on post-launch metrics before handoff, so the research impact can be tracked.

What I carry into every project now

  1. 01Ask about the past, not the future.
  2. 02Recruit the skeptics.
  3. 03Count before you claim.